As we approach the year's end it is worth a review of what has happened over the past few quarters. I present here some useful metrics of what may have transpired since we yet know the true outcome, we may be just in the eye of this storm with more to come.
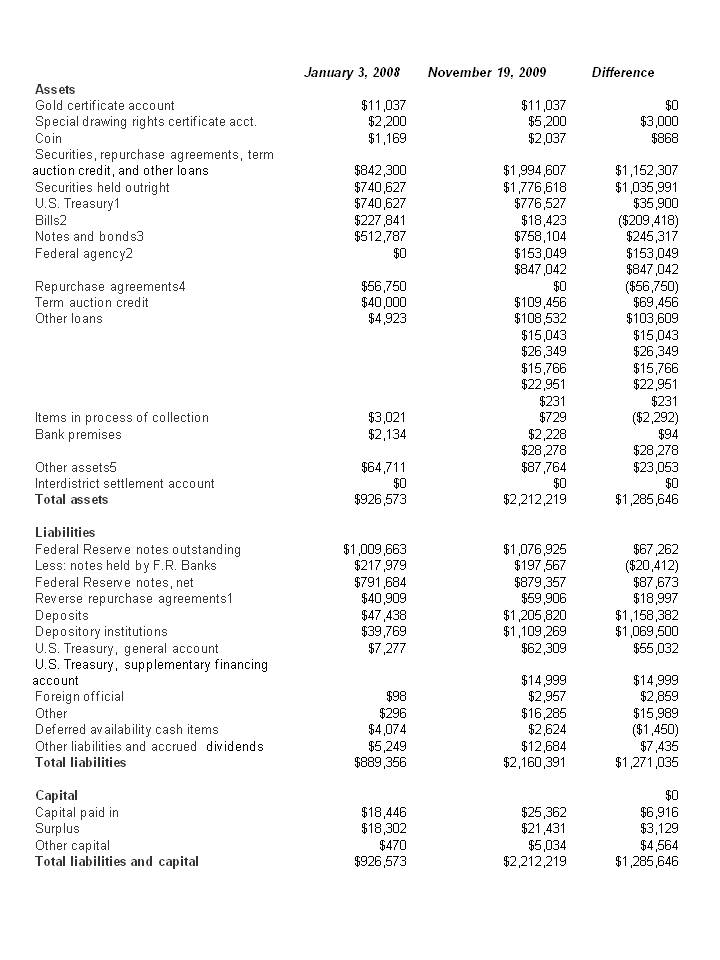
First we present the FED Balance Sheet, BS, from January 2008 and the latest. We show this below. Careful study of this will reveal how the FED has assumed great debt, albeit listed as assets, which in reality is the junk it took off the books of the banks. In return they got money and placed much if it in their reserve accounts, earning interest. Thus banks get interest yet pay no interest. Good deal if you can get it. They can.

We then show how the assets are broken out on the current BS. This is below:

The chart below depicts the difference in the FED assets. The red spike is the junk the FED has placed on its asset side of the BS, the junk taken off the banks BS.

We have always been concerned about inflation so we monitor the following. This is one of several metrics. It is the ratio of M1, the simplest and most volatile measure of money in the system, to the monetary base which is cash plus reserves at the banks. As we have seen in the case of M2/MB ratio we examined months ago this also shows a drop but what is worrisome is the continuing decline. It had stabilized but it now is declining again. Why, most likely an increasing MB due to excess reserves. The banks still are not lending. No lending, no spending, no economy.

Yet when we look at the MB we see the following.

The MB has again increased which accounts for our above assertion. This is a real concern since the reserves just increase.
The real problem is as follows, the total public debt. It is now well above $12 trillion and the current Administration is clueless as how to handle it. We have the same team which almost bankrupt Harvard at the helm.

We do not see any pressure for near term inflation but the exploding debt is not the least bit helpful, despite what Krugman and his ilk contend. This must be paid off, and further the cost of it will soon increase. Government programs do not generate wealth.Job Summits are just great meetings for fund raisers. Real jobs are created by entrepreneurs, not corporate executives. Sorry guys, you have the wrong group.
The only hopeful sign is that the spikes in increase are slowed as we show below.

We separate out the debt in the hands of the public below. That means China and the others.

The cost of the debt is the ongoing question. The following is the Treasury yield curves for the past period. One should note that they are downward, a good sign, yet the spread is increasing greatly and the short term drops more than the long term. We are borrowing short term so that when we see the need for long term we may face an inverted yield curve, a bad thing indeed.

How well do we fare with others, look at the following currency curves.

The above shows the ups and downs but the Euro and Yen are of concern.
Finally we ask if anyone in the US has any sense. The answer is that people are saving more. See the chart below.

Thus in summary we have the following:
1. The FED is loading up on bank junk.
2. Banks still are no lending.
3. People are saving more, giving the banks even more not to lend.
4. The current Administration is spending like there is no morrow, and they are lucky with low short term rates.
5. Currency pressures may likely increase rates and even invert the yield curve.
What does this mean? Most likely more pressure to spend at the Federal level making this worse. It may also mean a double dip. That is the concern. Finally the long term looks quite poor.
First we present the FED Balance Sheet, BS, from January 2008 and the latest. We show this below. Careful study of this will reveal how the FED has assumed great debt, albeit listed as assets, which in reality is the junk it took off the books of the banks. In return they got money and placed much if it in their reserve accounts, earning interest. Thus banks get interest yet pay no interest. Good deal if you can get it. They can.
We then show how the assets are broken out on the current BS. This is below:

The chart below depicts the difference in the FED assets. The red spike is the junk the FED has placed on its asset side of the BS, the junk taken off the banks BS.

We have always been concerned about inflation so we monitor the following. This is one of several metrics. It is the ratio of M1, the simplest and most volatile measure of money in the system, to the monetary base which is cash plus reserves at the banks. As we have seen in the case of M2/MB ratio we examined months ago this also shows a drop but what is worrisome is the continuing decline. It had stabilized but it now is declining again. Why, most likely an increasing MB due to excess reserves. The banks still are not lending. No lending, no spending, no economy.

Yet when we look at the MB we see the following.

The MB has again increased which accounts for our above assertion. This is a real concern since the reserves just increase.
The real problem is as follows, the total public debt. It is now well above $12 trillion and the current Administration is clueless as how to handle it. We have the same team which almost bankrupt Harvard at the helm.

We do not see any pressure for near term inflation but the exploding debt is not the least bit helpful, despite what Krugman and his ilk contend. This must be paid off, and further the cost of it will soon increase. Government programs do not generate wealth.Job Summits are just great meetings for fund raisers. Real jobs are created by entrepreneurs, not corporate executives. Sorry guys, you have the wrong group.
The only hopeful sign is that the spikes in increase are slowed as we show below.

We separate out the debt in the hands of the public below. That means China and the others.

The cost of the debt is the ongoing question. The following is the Treasury yield curves for the past period. One should note that they are downward, a good sign, yet the spread is increasing greatly and the short term drops more than the long term. We are borrowing short term so that when we see the need for long term we may face an inverted yield curve, a bad thing indeed.

How well do we fare with others, look at the following currency curves.

The above shows the ups and downs but the Euro and Yen are of concern.
Finally we ask if anyone in the US has any sense. The answer is that people are saving more. See the chart below.

Thus in summary we have the following:
1. The FED is loading up on bank junk.
2. Banks still are no lending.
3. People are saving more, giving the banks even more not to lend.
4. The current Administration is spending like there is no morrow, and they are lucky with low short term rates.
5. Currency pressures may likely increase rates and even invert the yield curve.
What does this mean? Most likely more pressure to spend at the Federal level making this worse. It may also mean a double dip. That is the concern. Finally the long term looks quite poor.


