Showing posts with label Yield Curve. Show all posts

Sunday, May 1, 2022

Yield Curve

 The following are some samples of the current yield curve as of Friday.

The spread is increasing:

Long term is lower, wonder why:
The spread is going back up as the FED finally tries to do something.


Tuesday, November 17, 2020

Yield Curve

 The following are current data on the yield curve. We had a brief negative yield but it seems to have returned to some normalcy.

However if you compare them for the past decade we see a low and flat yield.
This is the longer term spread
and the more recent spread with the negative value. We are back positive again and no inverted yield. I suggest this is worth following through any form of transition.


Tuesday, March 17, 2020

Yield Curve

Thought we would digress. This is the yield curve and we seem to be approaching free money!

Saturday, August 17, 2019

Yield Curve

Here we go:

Here are a few yield curves over the past which we have been following. There is a clear inversion. In a sense if you borrowed money say at 3 years you paid 1.5% but if then turned around and loaned it at 90 days you got 2% and thus with no real money you got 0.5% interest. Since theoretically if there were no limit on what you borrowed you could get rich quick. Except you do not know what the rate will be in say six months. But if you are a bank who cares.

Second point, most of the Treasury debt is short term, really in the 3 year range so this should be good. Our interest payments should be deceasing, but not as low as when we had the bank collapse.
Above is the actual spread of 10 years vs 90 days. It is negative and almost at the 0.5% level we just discussed. The long term rate reflects anticipated growth and the short term rate uncertainty on what is next. One question we should ask, is this all being manipulated and by whom? You can manipulate short term very easily, you go in and out of the market and have the FED complicit in the process. Are we seeing pre 2020 election manipulation but done domestically?
Just look at the short term rates. They have taken off after the 2016 election, some reduction but not much. The FEDs balance sheet is still a mess, a lot of useless paper resulting from the incompetence of the great recession of 2008.

The questions we should be asking are: (i) do we have any major systemic internal financial collapse issues?, (ii) can a recession be driven domestically for political gains?, (iii) if so one must ask by whom and who can solve the problem, or it just a political move?

Thursday, May 30, 2019

Yield Curve

The following is the current yield curve.
Note the extensive inversion and flatness.

Here is the spreads:
This does not bode well. The long term rate reflects growth and it is now sinking. The short term rates reflect Government operating costs which are exploding. This is a wedge scenario and one should expect it to be reflected in the stock market soon.

This yield curve is totally untenable. Is anyone looking?


Friday, March 22, 2019

Treasury Spreads

Above are a few Yield Curves. Look at yesterdays. It is really inverted. The dip in the 10 year region is significant. Short Term yields are the highest yet.
The above is the spread of 10 year to 90 days. It is negative in the current period. It had gotten close before but now it is in real negative territory.

So you can buy a house and the rates are not too bad. But if you are the US Treasury and most of your debt is short term, you are in deep trouble. If we assume a 22 trillion debt at 2.5% annual interest rate that is $550 billion debt payments. So if you look at the Budget, you have $550 billion for interest, and still some $300-400 billion for the obligations under Obamacare.

There is zero chance of solving this problem. I think. Oh yes, massive inflation!


Monday, December 24, 2018

Merry Christmas ... Bah Humbug!

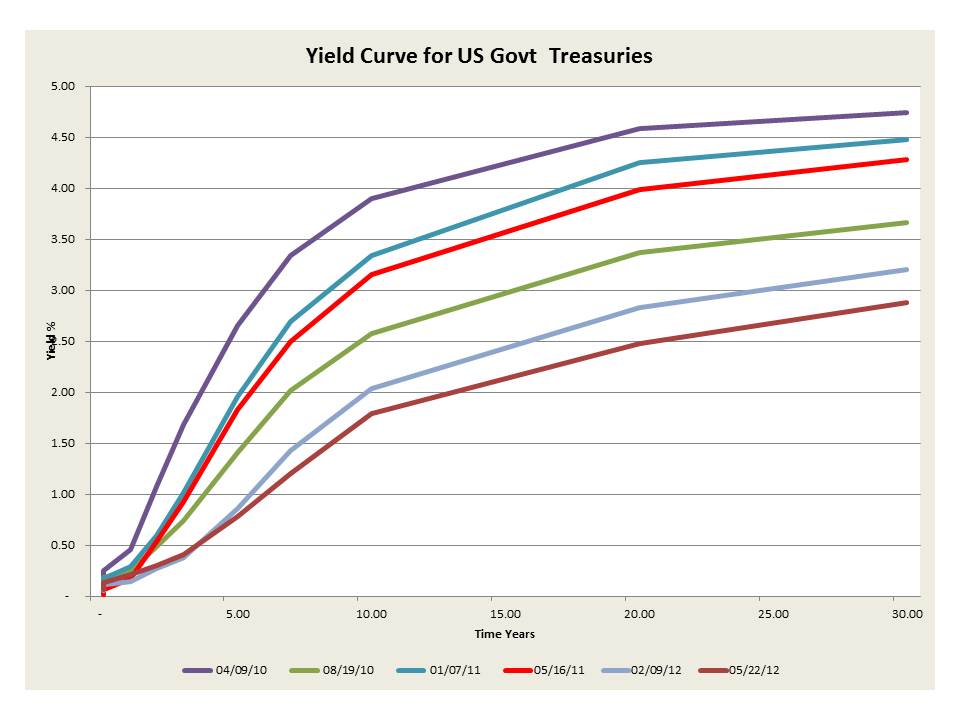
 The above is the flat, yes flat, Yield curve! No where to go but up!
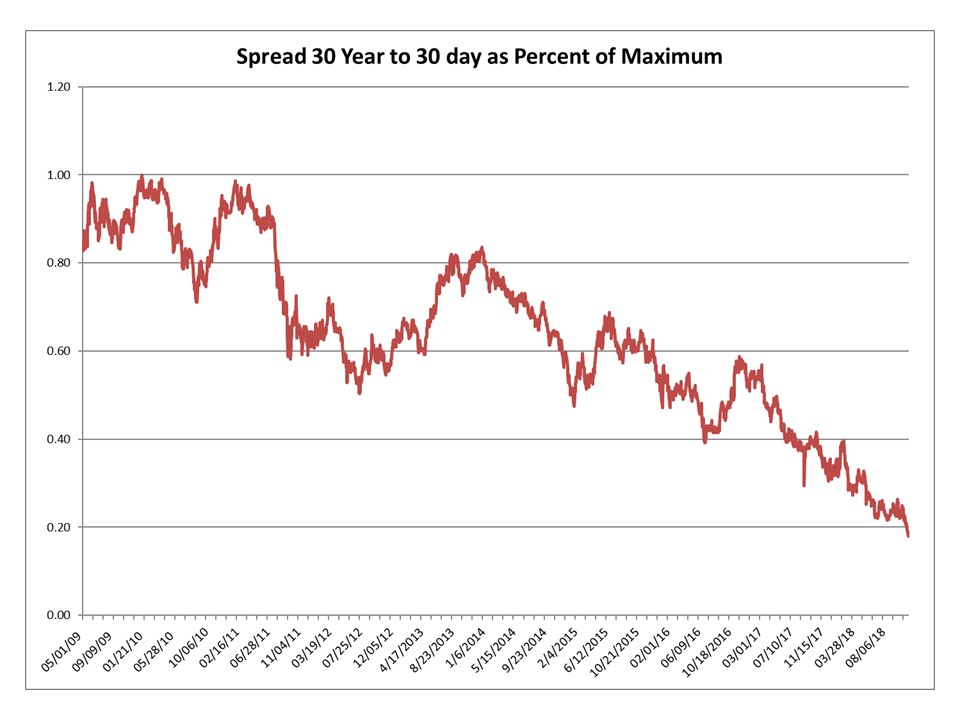
 The spreads are disappearing. They go to zero and then negative. Have not seen that since Carter!
 Now look at the above. The Yield Curve is FLAT. That means that the short term cost of money equals the long term opportunity. Namely why borrow to build if you go no where! Thanks to the FED. Now this gets worse. Yes worse. The cost of our debt has exploded, and that will drop the long term growth inverting the Yield Curve totally. Again, thanks FED.

Now the DOW etc. It is on its way to 15,000! Yes folks, 15,000. Why? Simply that we have the worst communicating group ever in Government. Pull the Twitter switch folks! Think, write, then read it to the American folks. Let us know what you are doing.

I have seen this before. It is the owners of a family company making decisions by shooting from the hip and having all the employees erratically chasing him about. But this is a Government not a family owned business. We all own the business, it is our country. Stop it please with the Twitter stuff.

This is not a Recession looming, it is a potential collapse. Enough with the Twitter. Send in the adults. And oh by the way, in my many years of business I always found that the most pressing issues occurred during the so-called Christmas recess!

Tuesday, December 4, 2018

Inverting the Yield Curve

The yield curve has inverted. Not much but it is there. To those of us watching this it does not bode well. Short term chaos, saw it this AM and it will continue, and long term uncertainty.
The 30 day to 30 year spread is on the way to zero and below if we are not careful.

Thursday, October 11, 2018

Yield Curve

The several yield curves are shown above. The FED is slamming up the short term yield to brake inflation, even though we do not see any. We have gone from a FED who was out to lunch to a FED eating our lunch.
The above is the comparison over the last decade since the great Bush Collapse. The spread is dropping and the curve flattening. The worst problem is that most of our debt is short term and thus interest costs are exploding. So far no one has commented on this one.

Tuesday, June 26, 2018

Yield Curve

The yield curve is flattening rapidly. Now look at the spreads:
The above is longest to shortest.
The above is a more reasonable set of points but again notice the collapsing.

What does this mean?

1. Our debt is short term, namely we now must pay more in interest.

2. Long term reflects growth, which is stagnating. Yet GDP seems to reject that. Perhaps the bloat on the FED BS.

3. This is also a warning for a recession. Hold on to your hats!


Thursday, April 19, 2018

Yield Curve

The above is the yield curve data as of yesterday. It is truly flattening. Short term rises and long term drops. Greater short term uncertainty and poorer long term prospects.
Just look at the above. We have a much lower spread and an exploding short term rate. Remember that the Interest of Federal debt where 75% is short term, or $3 trillion short term, also explodes as short term rates increase. With the then lowered long term growth prospects and the increased short term costs this is bleak!

Friday, February 9, 2018

Interest and the Market

The yield curve shows two characteristics. First it is still flattening. Second it is rising.
The rise is worrisome but the lifting of the low rate is truly of concern. We have been presenting this for almost a year now. As the low end rises as rapidly as it does and as deficit increases as it is, then the cost of that debt, most of which is short term, explodes! The cycle becomes unstable.
The above is an example. We shall examine the FED balance sheet again as it unrolls debt, almost all worthless, and at the same time finances the excess. This could be a deadly embrace.

Wednesday, May 23, 2012

Yield Curve, May 2012

The above is the yield curve at selected dates over the past 2 years. The curve yesterday is one of the lowest ever. The drop in the 30 year is almost a factor of 2. The advantages are clearly to lower borrowing, if one can accomplish the task, but the second is the pressure downward on fixed investments and the taxing of those on fixed incomes.
The above is another way to view it. Note how low we see the long term rates. Most likely driven by European fears. I suspect we may see another Recession before the Fall.
This is the 30 year to 30 day spread, the widest one would expect. It has reached an all time low!
This is the 10 year to 90 day spread, a typical metric, also at an all time low. The faith in any recovery has disappeared.
This is the same as above but we have combined them. Note the up tick on the 90 day but the down tick on the 10 year thus shortening the spread. This does not bode well for any recovery.

Wednesday, September 21, 2011

The Yield Curve: September 21, 2011

The above is the yield curve for today and the past year at selected points. As expected it has started to totally collapse. As we have said before it presents both opportunity and risk. As opportunity it makes potential borrowing of some interest. As a risk, for those on fixed incomes where the sources if returns on low risk investments it means that you need 50% more in assets in your accounts to get the same payout with the lower yield. That places a tremendous burden on the elderly as well as on pension funds with low risk investment profiles. Imagine what that does to state pension plans! It means that defined benefit plans are now underwater by that much more in just a year! That means an added effective burden on the taxpayers of those states!
This is the spread, and it also is tanking. Namely the difference between 30 years and 30 days is only a small percent. That means that the expected growth in the economy is most likely negative!\
The above is 90 day and 10 year spreads and rates. 90 day money is almost free. 10 year money is at an all time low. The spread is also at an all time low.

Thus one wonders what the FED is doing. The costs will be borne by all of the taxpayers. It is not as if the banks are lending it out. The banks are using the free money to still make high risk investments and receive great returns. Again on the backs of the taxpayers.