In December 2008 we assembled a Baseline Portfolio of stocks which we used to track market sentiment and inflation anticipations. The market all too often reflects anticipated moves. In view of the fact that interest rates are artificially low, and that we now believe that inflation is in the wings if not already starting, and that the other leading indicators show a 10% or plus inflation, we felt it worth a return to the Baseline.
Recall that the Baseline was assembled to reflect the following:
1. A 5.5% dividend payout which in December 2008 was a reasonable limited risk return.
2. The elements were broadly reflective of major elements of the economy.
3. None of the elements were considered as trendy.
4. We would take the position and do nothing thereafter while the current Administration was in place.
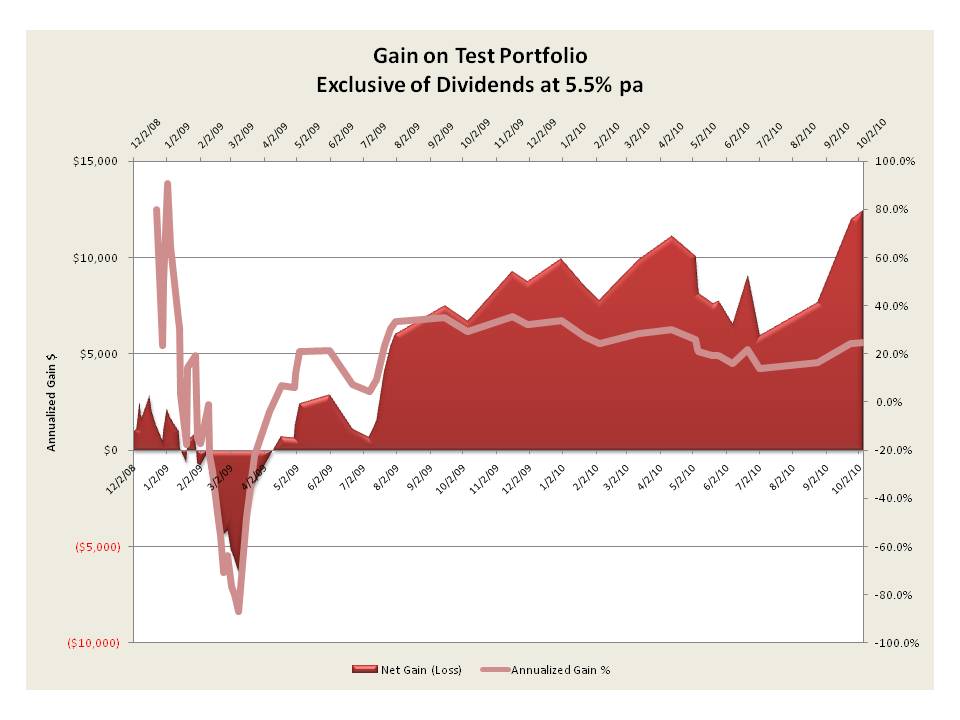
The first results are above. We see an annualized return of 30%. That is before any dividends. Why that return, are these companies doing so well, and the answer is not really. Perhaps in an environment anticipating zero inflation we would see say 8-10%. The added amount we believe reflects inflation. Current and anticipated. We argue that there is about a 10% contribution from current inflation plus an added 10% from anticipated.
The above is the same data but showing the return slightly differently. Note the flat return on an on going forward basis.
The above shows the daily returns. The problem we see here is the sudden increase, that we believe is anticipated high inflation rates. People are streaming in for protection.
This analysis thus anticipates a 10% inflation on a going forward basis.
Showing posts with label Baseline Portfolio. Show all posts
Thursday, April 28, 2011
Tuesday, March 15, 2011
Market Snapshot
The use of the Baseline Portfolio we have been watching since December 1 2008 is shown above. We are seeing the downward slope of the bundle and the yield is slowly declining. The problem is that the market has been the only safe haven for much of the investment given the lower rates of the bond markets.
The above shows a better view perhaps of what we have been saying. We were on an upward trend but Japan has brought that to a halt.
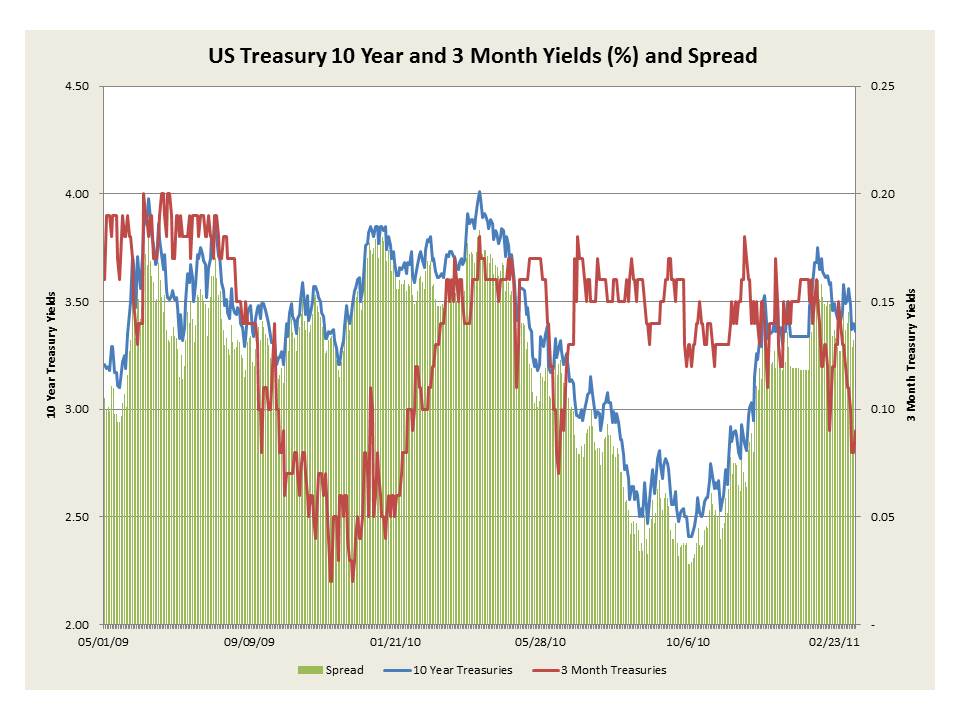
The yield curves are shown above. The low curve was last year in August but we see a steepening now.
This shows the spread and we see that the spread is nearing the peak over the past two year period again. The question is will we see a higher spread. The FED has kept the lid on this but like nuclear reactors sooner than later the pressure will be just too much.
This demonstrates the 90 day and 10 year rates and spread. The spread here is back to peak and the 90 day yields are drawn back down again, but the 10 years are not that high.
Thus one must ask, where are the returns. For those on fixed incomes and those near retirement this poses a disaster situation. Place SSI pressure on this and we will see an explosive result in the next election when this becomes more apparent.
Labels:
Baseline Portfolio,
Economy
Tuesday, February 8, 2011
Baseline Portfolio February 2011
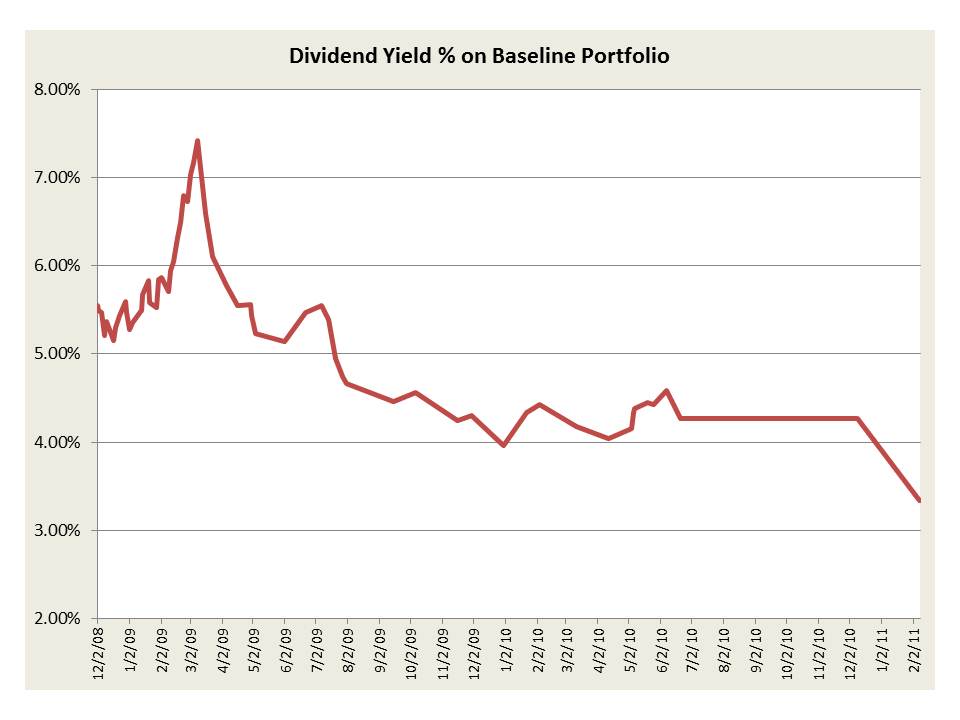
For over the past two years we have been tracking a baseline portfolio. It was in our belief a reasonable portfolio for the time and it yielded a 5.5% dividend yield at the time. Now we are down to a 3.2% dividend yield.
The above shows the decline in the effective dividend yield. It peaked in March of 2009 and then as the market improved it declined.
The above is the gain and percent gain over time. The market has been increasing at a rapid rate for the past year. We believe that amongst the stocks in this portfolio it is both a sign of recovery but also of inflation.
This is the same but a different view. We believe that the gains since March 2009 are reflective of the above two mentioned factors.
The above is the concern in that in the past few months we have seen less recovery and more inflation. One need look merely at the rates of increase with no down period.
This is the total gain since December 2008 of each. Note IBM, Dow and DuPont are the greatest with Alcoa behind. Dow, DuPont and Alcoa are in effect commodity oriented and IBM is selling infrastructure support. Verizon has gone no where. It is not a commodity and it has stalled in price as has J&J as well as Kraft. Kraft is a value added processor and we have seen little intrinsic value. Verizon has added tremendous technology with no return. J&J is spot on in health care and has also stalled.
Labels:
Baseline Portfolio,
Economy
Saturday, January 8, 2011
Baseline Portfolio: January 2011
In December 2008 we prepared a simple Baseline Portfolio to measure the markets core response to the then incoming Administration. The stocks were selected to each yield a dividend in excess of 5.5% pa and we paid little attention to capital gains, it was a pure dividend play. The above shows the results by date of that portfolio. It demonstrates a consistent 20% annual return since June 2009 and has changed very little. The stocks were also selected to be core economy stocks.
The same as above we show below for a different view:
We also calculate the percent daily change by day and we show that below:
One can see the volatility in early 2009 and then it has settled down considerably for the past six months.
Finally we show the total gains by each stock selection below:
This was surprising. Here DuPont is a core grower followed by Dow and then IBM. Despite all the high tech issue one wonders if these are market leaders and are predictors of growth in other segments. J&J and Verizon have gone no where, the Verizon return has recently been bolstered since late last year it was near zero. The sector returns may very well be predictors of a recovery.
Labels:
Baseline Portfolio,
Economy
Tuesday, October 5, 2010
Baseline Portfolio: October 2010
We have been tracking the Baseline Portfolio since December 2008. In a sense it is a measure of the Market's view of the current Administration.
Here is the latest.

The gain on the original $25,000 portfolio is now $16,000 plus a 5.5% annual dividend yield. This comes out to a 22% annual yield. Note that we saw the initial dip and then the return with the annualized return remaining at the high 20% level.

We depict the same above showing growing gain and a stable rate of return on this core portfolio.
The following is a daily rate of return plot.

The Market seems quite strong and perhaps we will not have a classic October surprise. Yet there is the question of where is the demand coming from? The elements of the portfolio are shown below with their total gain over the period. All but Verizon have done well.
Here is the latest.
The gain on the original $25,000 portfolio is now $16,000 plus a 5.5% annual dividend yield. This comes out to a 22% annual yield. Note that we saw the initial dip and then the return with the annualized return remaining at the high 20% level.
We depict the same above showing growing gain and a stable rate of return on this core portfolio.
The following is a daily rate of return plot.
The Market seems quite strong and perhaps we will not have a classic October surprise. Yet there is the question of where is the demand coming from? The elements of the portfolio are shown below with their total gain over the period. All but Verizon have done well.
| Verizon Communications Inc. | 5.53% |
| International Business Machines Corp. | 77.40% |
| The Dow Chemical Company | 57.03% |
| Johnson & Johnson | 12.69% |
| Kraft Foods Inc. | 22.17% |
| E.I. du Pont de Nemours & Company | 103.15% |
| Alcoa Inc. | 28.33% |
Labels:
Baseline Portfolio,
Economy
Tuesday, August 3, 2010
Baseline Portfolio Update: August 2010
On December 1, 2008 we created a baseline portfolio to measure the economy via a few stocks over the new administration. The stocks were chosen to represent large dividend yielding companies across the spectrum of markets.
The overall return in that year and a half plus is shown below:

IBM, Dow and DuPont have done quite well. It is not clear what that says yet they have extraordinary performance. Verizon is in the tank, perhaps the flaps over broadband. J&J is stagnating, but better than bonds.
Here we show the returns over time:

And we present an alternative view here:

Clearly the gross return is there but the annualized returns have flattened or decreased over the past year or more.
The overall return in that year and a half plus is shown below:
IBM, Dow and DuPont have done quite well. It is not clear what that says yet they have extraordinary performance. Verizon is in the tank, perhaps the flaps over broadband. J&J is stagnating, but better than bonds.
Here we show the returns over time:
And we present an alternative view here:
Clearly the gross return is there but the annualized returns have flattened or decreased over the past year or more.
Labels:
Baseline Portfolio
Friday, July 2, 2010
The Baseline Portfolio
The market seems not to like what it sees from Washington. I go back to the baseline portfolio I created in December 2008 and present the data here.

The above shows what has been happening over the period. We are declining now rapidly.
The details we show below:

And for this year specifically we see the following:

The drop is increasing in rate. These are core businesses and they seem to be now dropping off the cliff.
The above shows what has been happening over the period. We are declining now rapidly.
The details we show below:
And for this year specifically we see the following:
The drop is increasing in rate. These are core businesses and they seem to be now dropping off the cliff.
Labels:
Baseline Portfolio
Thursday, May 20, 2010
Baseline Portfolio on a Dive

We see a continuing of the decline of the Baseline Portfolio. We believe that this will continue as both European uncertainty continues and the US Congressional confusion along with debt continues to cloud the future.
There may be a real chance that we will see a 20% downward correction of the next few months, and worse if an"event" happens.
Labels:
Baseline Portfolio
Friday, May 7, 2010
Baseline Portfolio: Down Again
The above is our Baseline Portfolio. It is on the way down again. In the Spring of 2009 we saw the largest drop after the current Administration took office and we see the same thing happening again.
The following Figure depicts the per day changes.
The negative swings in early 2009 are starting again. There was a long period of quiet consistent growth but now we see dips which are close to those of early 2009. Given the Euro problems and the fact that unemployment has increased again, we anticipate further negative volatility. This will place great pressure on the downside and may very well extend through the summer till fall.
Labels:
Baseline Portfolio,
Economy
Tuesday, April 13, 2010
DOW 11,000 and the Baseline Portfolio
This is our baseline portfolio which we have been tracking since December 1, 2008. The interesting observation is that the annualized gain has been stable to slightly decreasing since August of last year. There was the dip a year ago and then it rebounded and has remained on a constant uptick, yet if one looks at it from August 2009 onwards the gains are relatively modest but steady.
The issue is that it is a rebound gain but the question still is that of inflation and deficit/debt.
Labels:
Baseline Portfolio,
Economy
Saturday, March 13, 2010
Baseline Portfolio: March 2010

We continue to track the Baseline Portfolio which we created in early December 2008. The first observation is that the annualized gain, albeit still high, has been slowly declining. The portfolio showed significant volatility at the beginning of the current Administration but has since shown a slow but continuing decline.
The major stock which is a surprise is still Verizon. The reasons for its decline are still somewhat a mystery since we see significant top side as LTE and other technologies are deployed. IBM and Dow Chemical are the greatest returns showing over 60% in this period. IBM has been a solid predictor of a recovering business climate and Dow Chemical is a harbinger for strong economic growth. In many ways Verizon would be a lagging stock in such a combination.
Kraft and J&J show a 15% return, modest and better than the Treasury rates especially when dividends are added in. Both are also market laggards. They await for the consumer to return.
Labels:
Baseline Portfolio
Thursday, February 4, 2010
The Market, the Portfolio and the Budget

The market is on a downturn and we believe it is due primarily to the Budget proposed by the current Administration. The above is our baseline portfolio which as we have recounted had been started in December of 2008. That was near the nadir of the market and we have seen the performance as we have progressed through the current Administrations economic plan.
As we have been showing the proposed Budget is fiscally unacceptable. Now all outsiders see that to be the case. The economic "team" inside the current Administration appear to have no understanding of the implications of their actions.
Sovereign Wealth Funds and others comparable, including China in toto, and even most likely Russia in a strange way, may force the current Administration back to a responsible path.
If I remember correctly Orszag was a classmate of my daughter in the MIT pre-school "graduating" the same year. Thus my image of him is frozen in time as a three year old. I wonder if anything has been learned since then?
Labels:
Baseline Portfolio,
Economy
Friday, January 1, 2010
Baseline Portfolio: End 2009

We present the Baseline Portfolio as of the end of the year 2009. Note that it has been stable as regards to annualized gains since July. Frankly the stability of the gain is quite interesting. This implies that the core economic elements which compose this Baseline Portfolio are continuing to sustain themselves. In effect, the market for the core has returned to some form of stability since early July. As for 2010 there are still concerns outside of the core. Commercial Real Estate and High Yield debt laden companies are the focus in 2010. We anticipate unemployment still to peak at 10.5% and we expect the national security issues will drive much of the discussion in 2010, an unexpected turn for the current Administration.
Labels:
Baseline Portfolio
Monday, November 30, 2009
The Baseline Portfolio; One Year Later

The Baseline Portfolio we started a year ago, to the day, is shown below. It has amassed a 32% annual return on face value plus a 5.5% return from dividends. This is a total of about 37% up from December 1 of 2008. The only element still down is Verizon for reasons we cannot fathom. Yet this portfolio does memorialize the ups and downs of the year, especially just after the current Administration took over. More on that on the morrow.
Labels:
Baseline Portfolio
Monday, November 16, 2009
Baseline Portfolio Update

We have updated our portfolio which we introduced December 1 of last year. It is averaging a 40% annualized rate of return from that date. It was originally a $25,000 bundle of stocks in core businesses and it has gained almost $9,500 in gain and $1.500 in dividends. We are tracking this since it represents the bundle of typical stocks. If interested look at prior Baseline Portfolio listings.
Labels:
Baseline Portfolio
Tuesday, October 6, 2009
Yield Curves, Portfolio and Implications
We have update the yield curve data and have also looked at the Baseline Portfolio again. The data is presented here.
The yield curve as of yesterday is shown below. It appears to flatten at the 20-30 year levels.

We show the variation in the 90 day and 10 year rates and their spread below.

The spread is depicted by itself below. This is the 90 to 10 year spread.

There is little variation at this time. The FED seems to be holding this in control. The spread is back down to where it was at the beginning. The rates show some volatility.
We show several date and their rates. Again the variability seems minor at this time.

Finally we show our baseline portfolio below.

The annualized return has remained relatively fixed at almost 20% for the past few months. These data sets combined seem to reflect a relative stable short term economy.
The yield curve as of yesterday is shown below. It appears to flatten at the 20-30 year levels.
We show the variation in the 90 day and 10 year rates and their spread below.
The spread is depicted by itself below. This is the 90 to 10 year spread.
There is little variation at this time. The FED seems to be holding this in control. The spread is back down to where it was at the beginning. The rates show some volatility.
We show several date and their rates. Again the variability seems minor at this time.
Finally we show our baseline portfolio below.
The annualized return has remained relatively fixed at almost 20% for the past few months. These data sets combined seem to reflect a relative stable short term economy.
Labels:
Baseline Portfolio,
Economy
Tuesday, September 15, 2009
Portfolio as of Mid September
The above is the latest data on our baseline portfolio started last December 1st. The annualized returns remain quite high and it appears that we are well out of a recession if this is an indicator.
Labels:
Baseline Portfolio
Sunday, August 2, 2009
The Portfolio at the End of July

This is our tracking portfolio. We saw the drop after the change in Administration and the rise has continued with an annualized gain of 33.4% without the dividends and with dividends it is 38.9%. This seems to show, along with the data on housing and to some degree on GDP and slight turning of the economy, and one could say a great turn. Yet the concern is that this was done without much input from the Stimulus. Summers was asked repeatedly today on the NBC Meet The Press, as friendly a venue as you could have for this Administration, if the turn is occurring without the Stimulus then why the Stimulus.
He was adamant that it continue no matter what. I guess that is the good Professor Summers, he seems in my opinion to fixate on his present position until he comes up with his next position. Perhaps this works in academia but this is all of our economic lives he is playing with!
Labels:
Baseline Portfolio
Monday, July 27, 2009
The Portfolio

The standard portfolio we have been tracking is doing quite well. Perhaps with Congress in deadlock and their vacations coming up the market felt that perhaps nothing will happen, good thing perhaps. Just look what happened to the market when they passed the stimulus bill. Maybe there is something in this chart.
Labels:
Baseline Portfolio
Tuesday, July 14, 2009
Portfolio Update

We thought it would be worth looking at our sample portfolio as we described just as the current Administration entered the scene. We have been tracking it since December 1, 2008 when we "purchased" it. It is a breadbasket group. It consists of:
| Verizon |
| DOW |
| IBM |
| J&J |
| Kraft |
| DuPont |
| Alcoa |
We now have a dividend yield of 5.6% and a stock yield of 9.1% for a total annualized yield of 14.7%. There has been a recovery of sorts. We agree that based upon our data as we have been presenting it the Recession is slowing yet we still feel that we will hit 10.5% unemployment since we will overshoot staffing cuts but the other side will still be explosive with the results from the stimulus.
Labels:
Baseline Portfolio
Subscribe to:
Posts (Atom)