Now for the latest data on unemployment:

The above is the Romer curve. We should have now been down well below 7% or so if she had any credibility. We are reportedly at 9.5% and holding but our analysis indicates we are closer to 12.5%. And it has begun to grow again.
The Romer error data we show below. She was way off and remained that way. She tried in my opinion to "chuckle" her way through the explanations. The answer was simple, she was wrong, but why? This was the first dictum from the current Administration and it was way off, as we suspect are most other issues relating to economics.
Here we have the breakout of data on what the percent distribution is for the latest report by sector. We will show the growing Government and Health and Ed sectors. This is growth in controllable union sectors where the money goes in, the union dues go up, the union then pays off the politicians and around and around. Chicago politics!

Now we show the employment change by month by sector for this year.

The two blips were the on and off census workers which distorted everything. July appears to be reasonable in that there were additions and losses but no dramatic drops. Goods producing is up which may be a good sign of sorts.Leisure is down which means that despite the summer season families are saving and not spending.Yet durable manufacturing is up but non durable is down, a bad sign again.
We show the above with the Government spending taken out:

Here one can see the detail better.
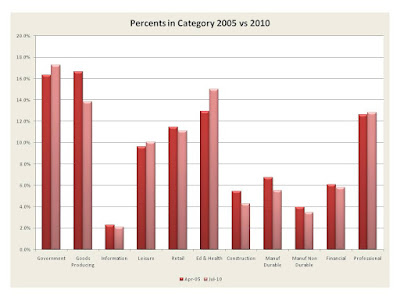
Now we look back to 2005 and compare percents by categories.

Government and Ed & Health have climbed and Goods producing, construction and manufacturing has dropped. Namely we see an economy of people dependent on fewer and fewer value creators.
We also looked at the true employment base as we have done monthly. The population increased which means the employable base has increased.We pegged our date as June 2005 and the key inputs are below:

Then when we calculate the unemployment rate using the population and the number of employables based on a fixed percent of the population using June 2005 as a baseline we obtain the following:

This shows an unemployment rate in excess of 12.5 % and growing. Thus we believe that we may still see unemployment per the Government still peak 10% in the next year. There is no plan other than pumping money into public unions like SEIU to keep the economy afloat.
When you look at what Congress and the Administration is doing and compare it to the note on China and its patents you see a deadly trend for our economy.


