
The PPI and CPI are shown above. They show signs of a continuing growth and as such reflect the change from the anticipated deflationary trend at the peak of the recession. However we also argue that the change is also a reflection of the change due to the readjustment of oil prices. We depict the annualized rates of change below:
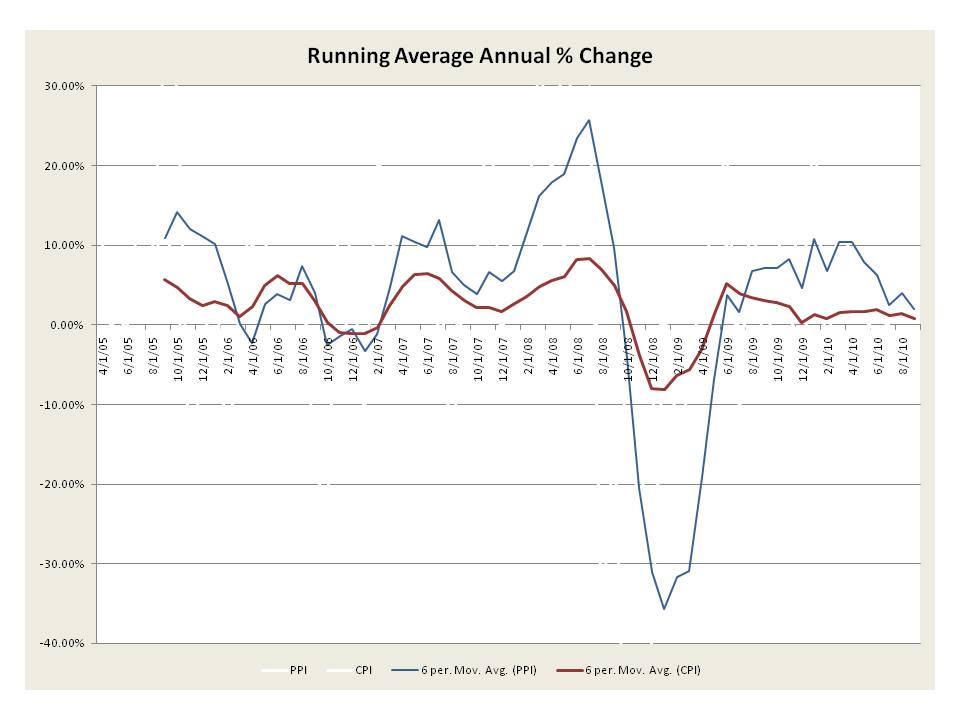
First the percent changes in PPI and CPI. Despite some concern they have leveled off at a nominally low rate but as noticed before PPI is still increasing at a higher rate than CPI. The CPI seems quite nominal due to control on energy costs of late.

Food may see some future increases.Consumer credit and housing are depicted below: They have remained constant for the past few months with no significant change. The totality of metrics is shown below:

Now as to the deficit:

This depicts the current receipts and expenditures. Receipts have show a slight up tick but expenditures have become obscene. The current administration seems totally ignorant of this issue and any attempt to create a stimulus is merely an income transfer to union workers. The Romer piece commented upon yesterday is just another example of useless and foundationless rhetoric by those who frankly should know better but alas are clueless.
The actual deficit annualized on a quarterly basis is shown below:

Studying this chart should send chills down the spines of all.


