We also are tracking per county doubling time. Below are the times per county for today.
And here is Morris over time.
Note that Morris now has well above 6 days doubling. That means the Academic model of 2.5 is not even close. I wonder if the folks using that model have at least driven down to county. I would drive down to Zip code. That is what real honest epidemiologists would do. Now six plus days means that by 15 April we have four time the number not 50! Opps......
Wednesday, April 1, 2020
NJ 2020 04 01
The total numbers keep increasing.
The daily rate of change is still below 20%
Which gives a doubling time above 4. This is well above the 2.5 leading to the 200,000 projected by the Academics.
The above is the per county numbers in total.
The above is the county percent daily change.
And above the changes allocated by County.
The daily rate of change is still below 20%
Which gives a doubling time above 4. This is well above the 2.5 leading to the 200,000 projected by the Academics.
The above is the per county numbers in total.
And above the changes allocated by County.
Labels:
Pandemic
I Like NK Cells
Natural Killer cells are part of the innate immune system. They are often one of the first to attack invaders. CIK cells are enhanced NK cells that have been shown effective against MDS. Now we have CAR NK cells.
As reported in Cancer Discovery:
Nearly 3 years after showing, preclinically, that natural killer (NK) cells outfitted with a chimeric antigen receptor (CAR) could be a promising alternative to CAR-bearing T cells, the first clinical data are in from researchers at The University of Texas MD Anderson Cancer Center (MDACC) in Houston. It’s early days, but “that we’ve seen responses even during phase I is very encouraging,” said senior author Katy Rezvani, MD, PhD. She and her team published results from 11 patients with relapsed/refractory non–Hodgkin lymphoma or chronic lymphocytic leukemia who received CAR NK cells targeting CD19.... These cells, also equipped with the IL15 gene to improve proliferation and survival, were derived from MDACC’s umbilical cord blood bank—unlike T cells, NK cells do not cause graft-versus-host disease, and a donorgeneric product can be safely administered. The objective response rate was 73%, including seven complete responses. Notably, none of the participants developed cytokine release syndrome or neurotoxicity, two common complications with CAR T-cell therapy. “I believed we’d see efficacy,” Rezvani observed, “but the safety profile is really beyond what we could have expected.” Phase II of the trial is under way; a global study is also being planned with Takeda.
These are powerful immune cells and enhancing them with CAR receptors cal allow for more aggressive treatments.
As reported in Cancer Discovery:
Nearly 3 years after showing, preclinically, that natural killer (NK) cells outfitted with a chimeric antigen receptor (CAR) could be a promising alternative to CAR-bearing T cells, the first clinical data are in from researchers at The University of Texas MD Anderson Cancer Center (MDACC) in Houston. It’s early days, but “that we’ve seen responses even during phase I is very encouraging,” said senior author Katy Rezvani, MD, PhD. She and her team published results from 11 patients with relapsed/refractory non–Hodgkin lymphoma or chronic lymphocytic leukemia who received CAR NK cells targeting CD19.... These cells, also equipped with the IL15 gene to improve proliferation and survival, were derived from MDACC’s umbilical cord blood bank—unlike T cells, NK cells do not cause graft-versus-host disease, and a donorgeneric product can be safely administered. The objective response rate was 73%, including seven complete responses. Notably, none of the participants developed cytokine release syndrome or neurotoxicity, two common complications with CAR T-cell therapy. “I believed we’d see efficacy,” Rezvani observed, “but the safety profile is really beyond what we could have expected.” Phase II of the trial is under way; a global study is also being planned with Takeda.
These are powerful immune cells and enhancing them with CAR receptors cal allow for more aggressive treatments.
Labels:
Cancer
Tuesday, March 31, 2020
I am Confused
When people give numbers I always try to go back and do a sanity check. Does it make sense. Well here are two simple checks.
First the distance a sneeze travels. An MIT type published in JAMA a piece saying a sneeze goes 27 feet. Specifically:
Owing to the forward momentum of the cloud, pathogen-bearing droplets are propelled much farther than if they were emitted in isolation without a turbulent puff cloud trapping and carrying them forward. Given various combinations of an individual patient’s physiology and environmental conditions, such as humidity and temperature, the gas cloud and its payload of pathogen-bearing droplets of all sizes can travel 23 to 27 feet (7-8 m). Importantly, the range of all droplets, large and small, is extended through their interaction with and trapping within the turbulent gas cloud, compared with the commonly accepted dichotomized droplet model that does not account for the possibility of a hot and moist gas cloud. Moreover, throughout the trajectory, droplets of all sizes settle out or evaporate at rates that depend not only on their size, but also on the degree of turbulence and speed of the gas cloud, coupled with the properties of the ambient environment (temperature, humidity, and airflow).
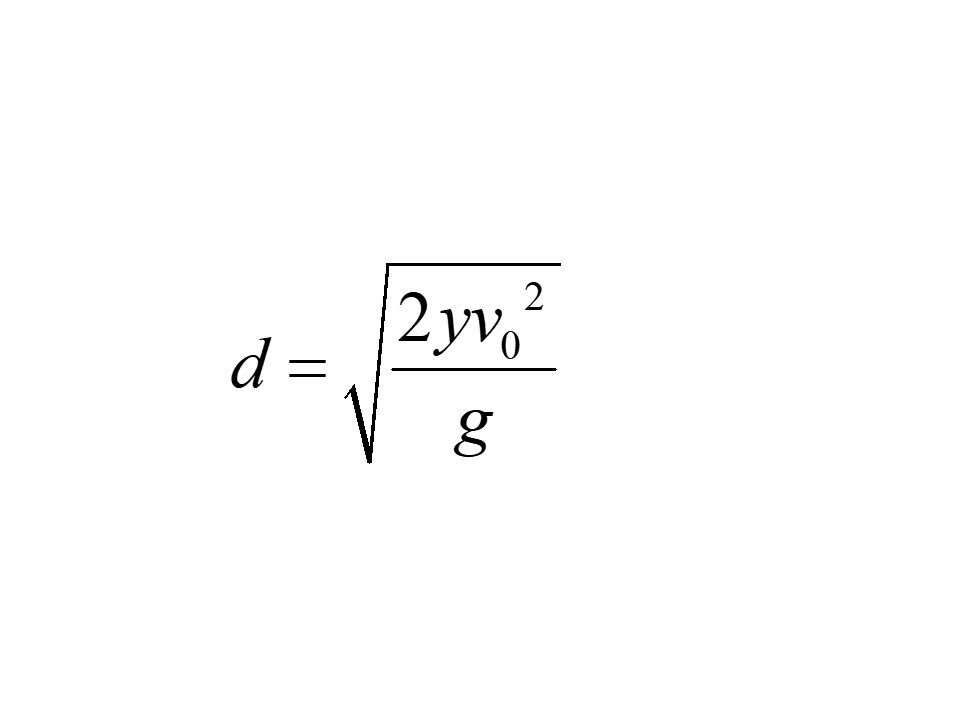
But let us do a simple check. If one fires a ball from a cannon at some exit velocity as described in the paper the ball drops 3 feet, a reasonable distance to make a sneeze deadly, only 4 feet, not 27. That is 7 time more distant. Now a cloud is a mass of particles so the dynamics are no different for any. Unless there is some cohesive lift effect. Unfortunately the author does not explain this almost order of magnitude difference.
Now to the doubling time. The equation below calculates the doubling cycles, not days, needed to get from 4,000 (now) to 200,000 in 15 days.
Since the Washington group has not revealed anything about the model we are back to the Three Card Monty world.
I have always done checks like this with business plans. Somehow when there are issues like this I don't invest. But somehow we have a group betting our entire country with a model hidden in a vault somewhere. Transparency anyone.
This problem requires the insight of Richard Feynman. Remember the Shuttle disaster!
First the distance a sneeze travels. An MIT type published in JAMA a piece saying a sneeze goes 27 feet. Specifically:
Owing to the forward momentum of the cloud, pathogen-bearing droplets are propelled much farther than if they were emitted in isolation without a turbulent puff cloud trapping and carrying them forward. Given various combinations of an individual patient’s physiology and environmental conditions, such as humidity and temperature, the gas cloud and its payload of pathogen-bearing droplets of all sizes can travel 23 to 27 feet (7-8 m). Importantly, the range of all droplets, large and small, is extended through their interaction with and trapping within the turbulent gas cloud, compared with the commonly accepted dichotomized droplet model that does not account for the possibility of a hot and moist gas cloud. Moreover, throughout the trajectory, droplets of all sizes settle out or evaporate at rates that depend not only on their size, but also on the degree of turbulence and speed of the gas cloud, coupled with the properties of the ambient environment (temperature, humidity, and airflow).
But let us do a simple check. If one fires a ball from a cannon at some exit velocity as described in the paper the ball drops 3 feet, a reasonable distance to make a sneeze deadly, only 4 feet, not 27. That is 7 time more distant. Now a cloud is a mass of particles so the dynamics are no different for any. Unless there is some cohesive lift effect. Unfortunately the author does not explain this almost order of magnitude difference.
Now to the doubling time. The equation below calculates the doubling cycles, not days, needed to get from 4,000 (now) to 200,000 in 15 days.
To get the doubling days we take the number of days and divie by the doubling cycles needed. Thus we get 5.64 for the number of cycles and 2.66 for the number of days. Now when we look at the actual data we calculate the doubling time as follows. We determine the daily growth rate. Then we calculate it as follows;
Now Item 2 is the NY Times and the presentation today. In that piece they say we are going from 4,000 deaths today to 200,000 by April 15. We showed today that the doubling time for NJ is 5.5 days or less than three doubling cycles in 15 days. The doubling time. However if you use the Government's numbers you go from 4,000 deaths today to 200,000 by April 15 then the
doubling time is 2.66 days or more than six doubles. Close but it assumes a fixed and non decreasing doubling. Also when you see it is a difference of almost 3, that is a fantastic difference in the final result. But we have seen an elongation of the doubling time. Given mitigation we expect that to continue. We seem to have projections based on nothing changing. Then why is the facts on the ground so disparate from the model being used? So I am confused. The facts show 5.5 the model says 2.6 and when you exponentially look at the difference it is fantastic! Yes, I am comparing mortality with reported infection rates but if one assumes a constant mortality rate per infection we are close. So what's up.Since the Washington group has not revealed anything about the model we are back to the Three Card Monty world.
I have always done checks like this with business plans. Somehow when there are issues like this I don't invest. But somehow we have a group betting our entire country with a model hidden in a vault somewhere. Transparency anyone.
This problem requires the insight of Richard Feynman. Remember the Shuttle disaster!
Labels:
Pandemic
Doubling Time
We thought it may be useful to plot the doubling time. This is the number of days required to double the infections. The above is the plot. Note that today we have the second longest doubling time which is a good thing. 5.5 days to double is a sign of improvement. We have this by county as well but it becomes a bit too complicated.
Also the University of Washington affiliate that is providing the data has a site of some interest. I tried to get info on their model but to no avail. Again to do real estimates one must have real data, to the micro scale and must adapt the data as more facts come in. Otherwise we are back to Three Card Monty.
The biggest problem in all these models reminds me of something I did while in grad school. I worked designing the third back up guidance system for Apollo. There was a guy who worked alongside me who did the error analysis. Each element in the system had some error associated with it. he would determine them then add all these errors up. One day I asked how accurate the system was to get to the moon. He said that the average trajectory got them there perfectly but the standard deviation was somewhere between Jupiter and Alpha Centauri. I then asked how do we prevent this? He said: simple, make measurements along the way and course correct on what you see. he then said, no one sends a ship from Plymouth harbor to New York ballistically, never looking through a sextant. Then he said: "I hope that thing of yours works". Well it did, on Apollo 13! You see, as they say, I had "skin in the game". These models are models of averages, uncorrected by the ongoing new facts and devoid of the detailed error analysis we used a half century ago.
Also the University of Washington affiliate that is providing the data has a site of some interest. I tried to get info on their model but to no avail. Again to do real estimates one must have real data, to the micro scale and must adapt the data as more facts come in. Otherwise we are back to Three Card Monty.
The biggest problem in all these models reminds me of something I did while in grad school. I worked designing the third back up guidance system for Apollo. There was a guy who worked alongside me who did the error analysis. Each element in the system had some error associated with it. he would determine them then add all these errors up. One day I asked how accurate the system was to get to the moon. He said that the average trajectory got them there perfectly but the standard deviation was somewhere between Jupiter and Alpha Centauri. I then asked how do we prevent this? He said: simple, make measurements along the way and course correct on what you see. he then said, no one sends a ship from Plymouth harbor to New York ballistically, never looking through a sextant. Then he said: "I hope that thing of yours works". Well it did, on Apollo 13! You see, as they say, I had "skin in the game". These models are models of averages, uncorrected by the ongoing new facts and devoid of the detailed error analysis we used a half century ago.
Labels:
Pandemic
NJ 2020 03 31
The infections continue as shown above. However we see some decline in the rate.
The rate has halved from yesterday and the previous trend. Now we assume that some testing is going on but NJ Public Health has always lagged dramatically. The problem is excessive political hand outs but the chickens are coming home to nest.
The total per county are above. Bergen still exceeds but its increase rate has fallen dramatically
The daily rates are shown above. Note the dramatic changes. The infections per PoP are below.
and the rates of change per day in the normalized ones are below:
Finally the rates of change per county as a part of the whole are:
Perhaps the leveling has begun.
The rate has halved from yesterday and the previous trend. Now we assume that some testing is going on but NJ Public Health has always lagged dramatically. The problem is excessive political hand outs but the chickens are coming home to nest.
The total per county are above. Bergen still exceeds but its increase rate has fallen dramatically
The daily rates are shown above. Note the dramatic changes. The infections per PoP are below.
and the rates of change per day in the normalized ones are below:
Finally the rates of change per county as a part of the whole are:
Perhaps the leveling has begun.
Labels:
Pandemic
Subscribe to:
Posts (Atom)