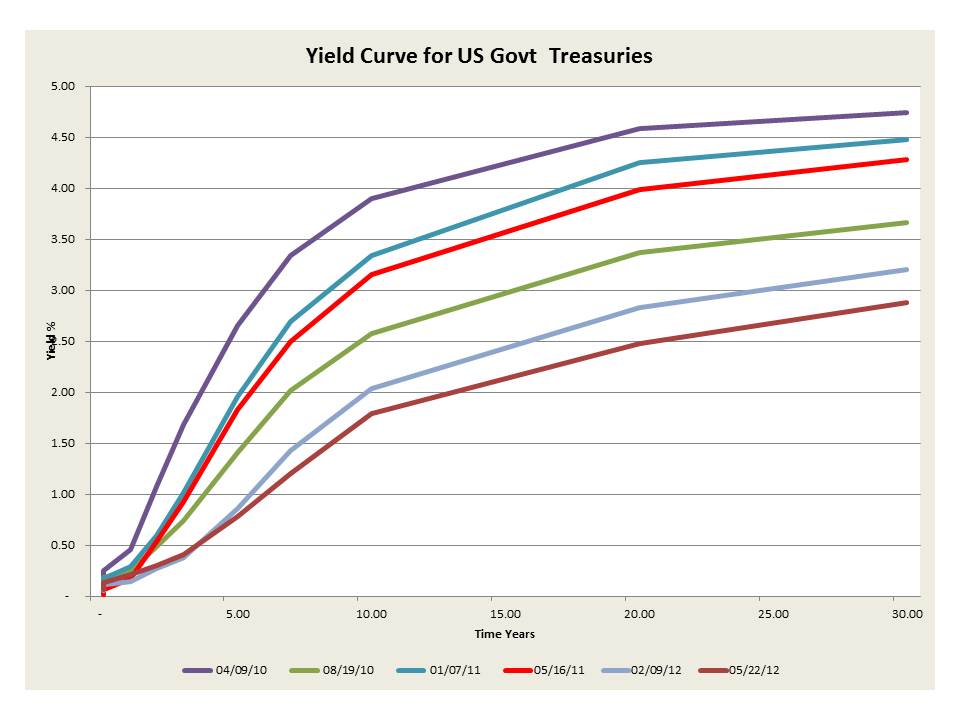
The above is the yield curve at selected dates over the past 2 years. The curve yesterday is one of the lowest ever. The drop in the 30 year is almost a factor of 2. The advantages are clearly to lower borrowing, if one can accomplish the task, but the second is the pressure downward on fixed investments and the taxing of those on fixed incomes.
The above is another way to view it. Note how low we see the long term rates. Most likely driven by European fears. I suspect we may see another Recession before the Fall.
This is the 30 year to 30 day spread, the widest one would expect. It has reached an all time low!
This is the 10 year to 90 day spread, a typical metric, also at an all time low. The faith in any recovery has disappeared.
This is the same as above but we have combined them. Note the up tick on the 90 day but the down tick on the 10 year thus shortening the spread. This does not bode well for any recovery.