As I go over the employment numbers I am always surprised by some strange issues. Let us begin as usual with the Romer curve or "Why we should not trust any California Economist, Ever!" approach to understanding the world.
The Romer Curve shows we should be at 5% but we are at 7.6%, or some number greater than 5%. I truly question the 7.6%. Remember the denominator counts. It really counts and the Labor reporting has truly manipulated this on this occasion.
Above are the Romer errors, they still are near all time highs.
Here we have the unemployment if we had a 2006 economy versus ours now. Note that we have still almost 11% unemployment but they show a greater participation rate than before.
The above shows a beginning to closing the gap but the gap is still substantial. We have had a real systemic change in the workforce.
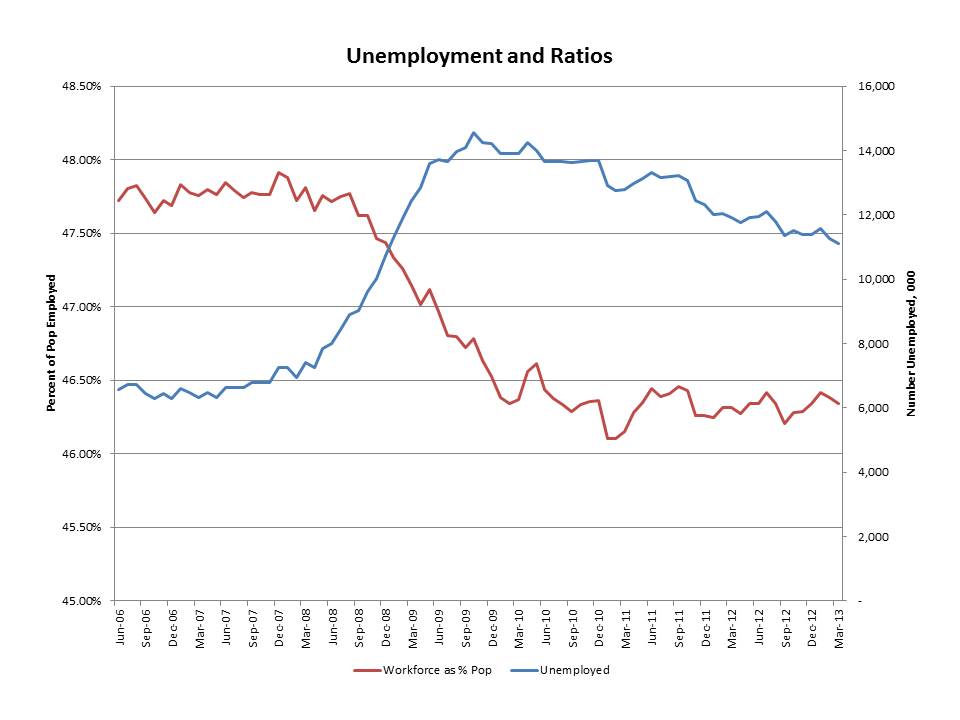
The workforce as a percent of the population has again dropped and is staying a good 2% points below where we were in 2006. Frankly participation is the true metric no the unemployment rate! We have been arguing that for almost 5 years and I see some of the economic wonders have caught on.
Now this is curious. It is the increase in population versus time and the corresponding required employment increase to match the population assuming June 2006 participation rates. Why the cycle and why the slow drop in population increase!
Finally is we plot the employment increase and then plot the variance from what it should have been from the actual we see that we are negative again and that it has been negative for a long while. There is no improvement! So we have our Government making up an absurd number to make folks feel happy while the workforce goes down the drain!