Prostate Cancer is a multifaceted malignancy. BRCA2 genes can make the result explosive and lead to rapid death. Many however are indolent. Knowing how to select which is which has not yet been achieved.
In a recent article a physical writes in Health Affairs:
The indolent nature of many prostate cancers has heightened concerns
that harms from treatment may outweigh those from the
disease and has resulted in a growing consensus in
favor of less aggressive screening and treatment. We sought to
understand
the population-level impact of this consensus on
the treatment of prostate cancer. Using national Medicare data for the
period
2007–12, we assessed treatment rates among men with
newly diagnosed prostate cancer. We identified both population-based
rates
(which are sensitive to changes in diagnosis and
treatment patterns) and rates among diagnosed men (which are sensitive
only
to changes in treatment patterns). We also assessed
trends in treatment among men with a high risk of noncancer mortality,
who are unlikely to benefit from treatment.
Population-based treatment rates declined by 42 percent, while rates
among diagnosed
men declined by only 8 percent. Treatment rates
among men with the highest noncancer mortality risk and regional
variation
were unchanged. These results suggest that
decreasing rates of diagnosis, changing attitudes, and guidelines
calling for reduced
prostate-specific antigen screening, not changes in
practice patterns among specialists treating diagnosed men, drove the
decline in population-based treatment rates.
Compared to policies that emphasize volume, those that emphasize value
in specialty
care have the potential to exert stronger effects
on practice patterns.
Read the last sentence carefully. Value. It is like Quality. It has not absolute meaning and it would appear that as it is in the eye of the beholder and not the patient, well you guess it. That was the core of the ACA. Not any per-existing condition, but who gets to decide who lives and who dies.
Now read Science Daily which reflects on this article:
The researchers recommend new payment models or other policies that
emphasize value of care over volume, which might provide more incentive
for specialists to choose observation over treatment. They also urge
participation in quality improvement initiatives, such as the Michigan
Urological Surgery Improvement Collaborative, which strive to provide
high quality, evidence-based care.
In addition, research continues to uncover new clues to identify
which men are at highest risk of aggressive prostate cancer and could
most benefit from screening and treatment. "That's really the concern here. We know prostate cancer is a deadly
disease in some men. We need better tools to identify which men should
be screened and among those diagnosed, which men should be treated
aggressively. This is still a black box. It's that uncertainty that
leads to different approaches to treatment based on how different
physicians view the risk. If we get better predicting who's at highest
risk, we can more accurately tailor screening and treatment,"
The statement is in my opinion grossly arrogant. The physician gets to decide if the patient should be treated? Really? What about the patient. After all he has paid for this. So we just let him die because some academic decides to do so.
Why does the ACA need to be repealed and redone? Life versus Death, the patient versus the system.
Monday, January 9, 2017
China and Trump
The current Administration seems fixated on the power of RT to influence Americans. Then there is such sites as China Daily which lays bare threats and uncertainty.
China Daily states:
...professor and chair of the department of political science at the University of St. Thomas in Houston, Texas, said: "Trump is about to create a very difficult period in China-US relations, one that may rival that of the 1950s and 60s. I am deeply concerned that Trump is rapidly moving US foreign policy toward a deep Cold War mindset regarding China. "My profound fear is that Trump has surrounded himself with anti-China hardliners who have little experience with or expertise on China, have rarely, if ever, visited the country, and have little understanding beyond textbooks and oped pieces of the nuances and subtleties of China's history, culture, and political system."
I am not aware of this Professor of what appears to be a small Catholic college in Texas, but it seems that he has become a statement maker for the Regime. Surprised no Harvard, Stanford, Yale or Princeton types.
In contrast the article continues:
...deputy director of research at the School of Regional and International Studies at the Far Eastern Federal University in Vladivostock, Russia, said the exchange of goodwill between Trump and Moscow signals subtle changes in Russia's ties with China. According to public opinion surveys, Russia was the only country to prefer Trump over Hillary Clinton, the Democratic Party's presidential candidate. "Since 2012, ties between Moscow and Beijing have been expanding and deepening, especially in the political-military domain," Lukin said. If Moscow normalizes relations with Washington, "the Sino-Russian partnership will continue, with the emphasis shifting to economics and trade", he added.
How much of this is game playing and muscle stretching and how much reflects a fundamental change is yet to be played out. China and Russia have had a tenuous relationship at best over the decades. You cannot buy anything Made in Russia at Walmart but there are still tons of Made in China.
It is surprising that the organ that the Chinese use to send out a message use Academics so far from the base. Vladivostok is not Moscow, but it is quite reputable. Houston is not Cambridge yet it is no where close to Vladivostok.
One should ask; what this message means and to whom was it directed?
China Daily states:
...professor and chair of the department of political science at the University of St. Thomas in Houston, Texas, said: "Trump is about to create a very difficult period in China-US relations, one that may rival that of the 1950s and 60s. I am deeply concerned that Trump is rapidly moving US foreign policy toward a deep Cold War mindset regarding China. "My profound fear is that Trump has surrounded himself with anti-China hardliners who have little experience with or expertise on China, have rarely, if ever, visited the country, and have little understanding beyond textbooks and oped pieces of the nuances and subtleties of China's history, culture, and political system."
I am not aware of this Professor of what appears to be a small Catholic college in Texas, but it seems that he has become a statement maker for the Regime. Surprised no Harvard, Stanford, Yale or Princeton types.
In contrast the article continues:
...deputy director of research at the School of Regional and International Studies at the Far Eastern Federal University in Vladivostock, Russia, said the exchange of goodwill between Trump and Moscow signals subtle changes in Russia's ties with China. According to public opinion surveys, Russia was the only country to prefer Trump over Hillary Clinton, the Democratic Party's presidential candidate. "Since 2012, ties between Moscow and Beijing have been expanding and deepening, especially in the political-military domain," Lukin said. If Moscow normalizes relations with Washington, "the Sino-Russian partnership will continue, with the emphasis shifting to economics and trade", he added.
How much of this is game playing and muscle stretching and how much reflects a fundamental change is yet to be played out. China and Russia have had a tenuous relationship at best over the decades. You cannot buy anything Made in Russia at Walmart but there are still tons of Made in China.
It is surprising that the organ that the Chinese use to send out a message use Academics so far from the base. Vladivostok is not Moscow, but it is quite reputable. Houston is not Cambridge yet it is no where close to Vladivostok.
One should ask; what this message means and to whom was it directed?

More on Employment January 2017
Last Friday the Government announced the latest Employment Stats. As usual we noted the mass amount no longer in the work force but we now take a look at details.
 The above is a plot of Government or Government related employment versus non-Government. It dropped for a while but we note it climbing again. This chart shows that as that climbs then more people doing real work are having to be taxed for people doing Government supported work.
 Again we show this as a Public versus Private sector breakout.
 Looking deeper the real reason is the explosion of employment in Health Care. Clearly the AMA has created a massive number of jobs, most at the lower end, and in turn these jobs are paid for from a taxation base. Unfortunately that is ll being borrowed. Compare this to the JAMA analysis presented earlier.
 The above is a listing of the Core workers during this period.
 The above is detail per pop. Finally below we compare before the Collapse and now.
 The above is a picture of the change in our employment structure.


Sunday, January 8, 2017
You Broke It, not BREXIT
And I thought the US Academy was in a state of collapse. But the Telegraph depicts the UK Universities as follows:
But students at a prestigious London university are demanding that figures such as Plato, Descartes and Immanuel Kant should be largely dropped from the curriculum because they are white. School of Oriental and African Studies (SOAS)'s student union is insisting that when studying philosophy “the majority of philosophers on our courses” should be from Africa and Asia.
The article continues:
Sir Roger Scruton, the philosopher, said the demands suggest “ignorance”. “You can't rule out a whole area of intellectual endeavour without having investigated it and clearly they haven't investigated what they mean by white philosophy,” he told The Mail on Sunday. “If they think there is a colonial context from which Kant's Critique of Pure Reason arose, I would like to hear it.'
Knowing Scrunton, and he is brilliant, he has more than a point. The irony is that these individuals led to the very creation of a civil society.
But students at a prestigious London university are demanding that figures such as Plato, Descartes and Immanuel Kant should be largely dropped from the curriculum because they are white. School of Oriental and African Studies (SOAS)'s student union is insisting that when studying philosophy “the majority of philosophers on our courses” should be from Africa and Asia.
The article continues:
Sir Roger Scruton, the philosopher, said the demands suggest “ignorance”. “You can't rule out a whole area of intellectual endeavour without having investigated it and clearly they haven't investigated what they mean by white philosophy,” he told The Mail on Sunday. “If they think there is a colonial context from which Kant's Critique of Pure Reason arose, I would like to hear it.'
Knowing Scrunton, and he is brilliant, he has more than a point. The irony is that these individuals led to the very creation of a civil society.
Facts and Then There are Parting Memos
For those who may have been examining this Blog over the past eight plus years one of our topics was the Romer Curve, which was the projection of unemployment
Now from the still current Administration comes a rewriting of history.
 They state:
From its peak, the unemployment rate recovered to its pre-recession average in mid-2015 and continued to fall, standing at 4.6 percent as of November 2016. This rapid decline came far more quickly than most economists predicted: as recently as March 2014, private forecasters expected the unemployment rate to remain above 5.0 percent until at least 2020 (Figure 1). Meanwhile, the labor force participation rate, which has been subject to downward pressure due to the aging of the U.S. population, has been broadly stable since the end of 2013, as the strengthening labor market recovery has led workers to enter (or reenter) the workforce, offsetting downward pressure from demographic trends.
To examine the facts just go back and look at my Romer curve analyses. At NO time did any data appear as indicated above. By month we tracked the actual versus the Romer projections. Even using the recalculations which employed massive numbers removed from the possible employment roles.
History is written by the victors. Not clear yet who they may be but when data such as the above is presented when the real data based on the Romer memo disputes it, I truly wonder. But alas, they are but economists. Worse yet, they are politicians.
Now from the still current Administration comes a rewriting of history.

From its peak, the unemployment rate recovered to its pre-recession average in mid-2015 and continued to fall, standing at 4.6 percent as of November 2016. This rapid decline came far more quickly than most economists predicted: as recently as March 2014, private forecasters expected the unemployment rate to remain above 5.0 percent until at least 2020 (Figure 1). Meanwhile, the labor force participation rate, which has been subject to downward pressure due to the aging of the U.S. population, has been broadly stable since the end of 2013, as the strengthening labor market recovery has led workers to enter (or reenter) the workforce, offsetting downward pressure from demographic trends.
To examine the facts just go back and look at my Romer curve analyses. At NO time did any data appear as indicated above. By month we tracked the actual versus the Romer projections. Even using the recalculations which employed massive numbers removed from the possible employment roles.
History is written by the victors. Not clear yet who they may be but when data such as the above is presented when the real data based on the Romer memo disputes it, I truly wonder. But alas, they are but economists. Worse yet, they are politicians.
Interesting Data
JAMA has an exceptionally interesting piece on Health Care costs and changes. The authors state:
From 1996 through 2013, $30.1 trillion of personal health care spending was disaggregated by 155 conditions, age and sex group, and type of care. Among these 155 conditions, diabetes had the highest health care spending in 2013, with an estimated $101.4 billion (uncertainty interval [UI], $96.7 billion-$106.5 billion) in spending, including 57.6% (UI, 53.8%-62.1%) spent on pharmaceuticals and 23.5% (UI, 21.7%-25.7%) spent on ambulatory care. Ischemic heart disease accounted for the second-highest amount of health care spending in 2013, with estimated spending of $88.1 billion (UI, $82.7 billion-$92.9 billion), and low back and neck pain accounted for the third-highest amount, with estimated health care spending of $87.6 billion (UI, $67.5 billion-$94.1 billion). The conditions with the highest spending levels varied by age, sex, type of care, and year. Personal health care spending increased for 143 of the 155 conditions from 1996 through 2013.
The following chart is quite interesting, albeit open for some discussion.
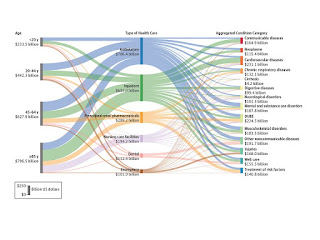 DUBE is Diabetes and a collection of other things. Frankly I would have liked to see T2 Diabetes separate but I suspect it and its sequellae are all over the chart. The greatest sum is in the 65 and older as one might suspect.
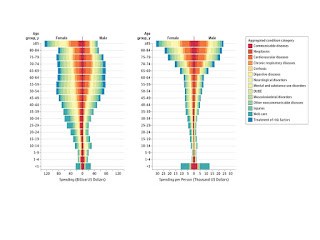 The above is interesting since it depicts annual costs total and per person by age and by disorder. Surprisingly older women are more costly than older men. Also as one would expect over 85 is costly. However I would expect that if one looked at the distribution it would be some 80:20 rule, namely 20% of these people account for 80% of the cost.
Finally the data below is of interest, which is a chart of Public Health spending.
 The ones with the greatest change are of most interest. Such as breast cancer with an annualized cost increase of 30%! I really do not know what to make of this one. But worth reporting.
From 1996 through 2013, $30.1 trillion of personal health care spending was disaggregated by 155 conditions, age and sex group, and type of care. Among these 155 conditions, diabetes had the highest health care spending in 2013, with an estimated $101.4 billion (uncertainty interval [UI], $96.7 billion-$106.5 billion) in spending, including 57.6% (UI, 53.8%-62.1%) spent on pharmaceuticals and 23.5% (UI, 21.7%-25.7%) spent on ambulatory care. Ischemic heart disease accounted for the second-highest amount of health care spending in 2013, with estimated spending of $88.1 billion (UI, $82.7 billion-$92.9 billion), and low back and neck pain accounted for the third-highest amount, with estimated health care spending of $87.6 billion (UI, $67.5 billion-$94.1 billion). The conditions with the highest spending levels varied by age, sex, type of care, and year. Personal health care spending increased for 143 of the 155 conditions from 1996 through 2013.
The following chart is quite interesting, albeit open for some discussion.


Finally the data below is of interest, which is a chart of Public Health spending.

Subscribe to:
Posts (Atom)


 Posts
Posts

