In a recent Trustee Report from Medicare SSI the authors Trustees first state the definition of the funds:
"There are four separate trust funds. For Social Security, the Old-Age and Survivors Insurance (OASI) Trust Fund pays retirement and survivors benefits, and the Disability Insurance (DI) Trust Fund pays disability benefits. (The two trust funds are often considered on a combined basis designated OASDI.) For Medicare, the Hospital Insurance (HI) Trust Fund pays for inpatient hospital and related care. The Supplementary Medical Insurance (SMI) Trust Fund comprises two separate accounts: Part B, which pays for physician and outpatient services, and Part D, which covers the prescription drug benefit."
Now the report presents the following chart:

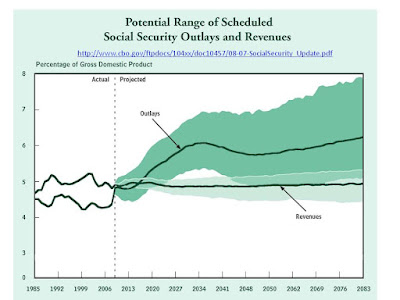
The issue is the concern regarding the explosion of Medicare, the HI and SMI terms. In a recent CBO Report on SSI they show a chart on SSI alone which is even more dire as shown below.

Here they are showing an even more explosive growth of SSI. These two will meet in the report to be issue on the morrow and all together these will set the scene for a battle on the exploding Government debt.
We wish to provides a few statistics regarding Medicare herein so that people can deal with the facts and not the politically motivated scare tactics.
Fact 1: What is Contribute to What by Whom? The following is the table which represents what we currently contribute from our salaries to SSI and Medicare. The following are percentages of gross income contributed by the employer and employee.
Employees: OASI-5.30 DI-0.90 OASDI-6.20 HI-1.45 Total-7.65
Employers: OASI-5.30 DI-0.90 OASDI-6.20 HI-1.45 Total-7.65
Combined Total: OASI-10.60 DI-1.80 OASDI-12.40 HI-2.90 Total-15.30
The total is 15.3% of the gross salary is contributed to these programs. 12.4% to SSI and 2.9% to Medicare. It is clear that SSI is substantially higher than Medicare and since Medicare is increasing due to health care costs one would suspect that this amount should increase. But by how much.
Fact 2: The over 654 population is growing as a percent of the total. This is shown below.

We will grow from 12% to just over 20% and almost two fold increase. This is less a longevity issue and more a demographic issue. We just are not having enough births and not enough immigration. There are several ways to address this. One is to move the age limits up to keep the percentages below say 15%. The other is to double the taxes.
Yet is must be remembered that people have contributed and as to SSI their contributions have already paid for their SSI. Thus either solution only addresses a problem created by Congress who already spent the money. Getting more money will never solve the problem of an entity which will spend whatever it can get its hands on.
We have already begun increasing the SSI age yet we have not addressed the Medicare age. This is the main issue.
Fact 3: In SSI only 78% of the payment go to contributors. The following chart depicts the SSI payouts.

And SSI payments have remained at or below inflation, about 3% per annum. SSI payments are controlled by the Government and there are no exogenous factors such as are the case in Medicare. We show this below.

Fact 4: SSI has no exogenous drivers whereas Medicare does. Medicare has been increasing as a percent of GDP whereas SSI has not. We show this below.

This is the curve which the Trustee report is concerned about. This is data up to 2008. Note that Medicare is approaching the same percent GDP as is SSI and it is increasing faster. In addition note that we as employees contribute only 25% to HI as we contribute to SSI. Thus SSI is well funded going forward if one looks at the demographics, not the Trust fund which has already been raided, but on a going forward basis HI has a problem.
Fact 5: The Medicare Funds are fine for the next ten years but the long term demographics will cause problems. The drivers of the problems are twofold. First the slow growth of GDP as compared to health care. Second the lowering of the employee bases in terms of value added. Namely there will be more service and government employees and fewer people creating value, such as entrepreneurs. The following chart depicts the next ten years of Medicare.

Thus the concern is not just one of lowering health care costs, nor one of moving age limits upward, but one of creating a growing economy.


