Things are not going well. Saw over a hundred middle school kids at local basketball court all lined up and mask-less. They were there for hours for what I gather was some PE event. Do our educators have a clue?
First the Ocean County explosion. Wonder what County Health Offices are really doing.
The chart below is the Morris County and Florham Park numbers.
The graph below is Florham Park, still low simmering most likely the schools.
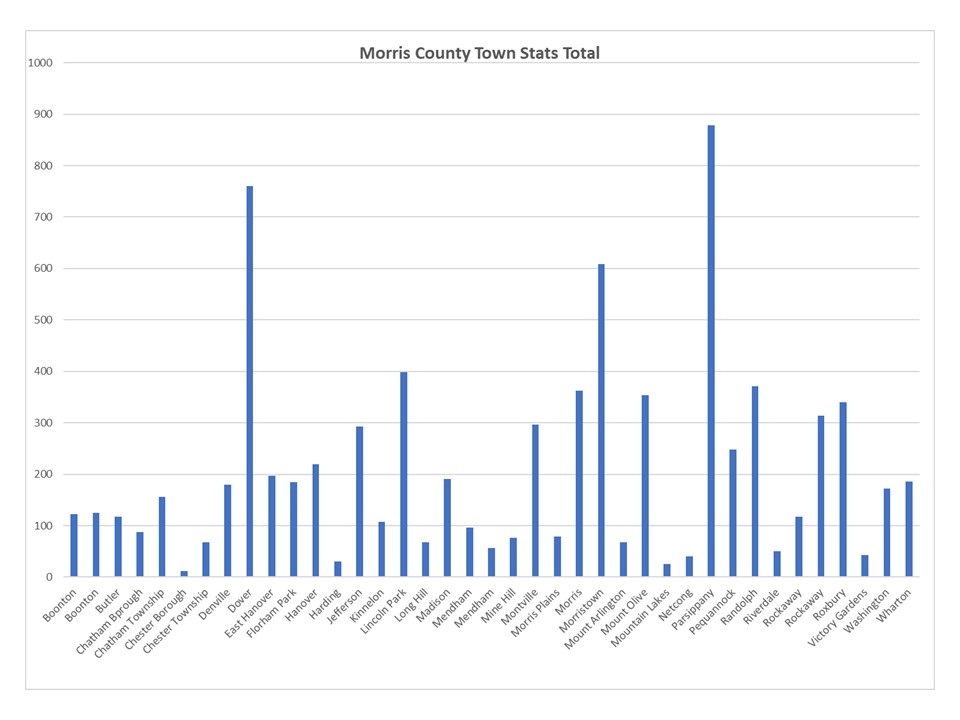
The chart below is Morris County Town stats. Still same hot spots.
The State is below. Dominated by Ocean County.
Morris County with a blip but steady low infection rate.
The infections per PoP per County. Ocean is a real mess, Lakewood seems the focus.
Here is Ocean by day. It may be slowing.
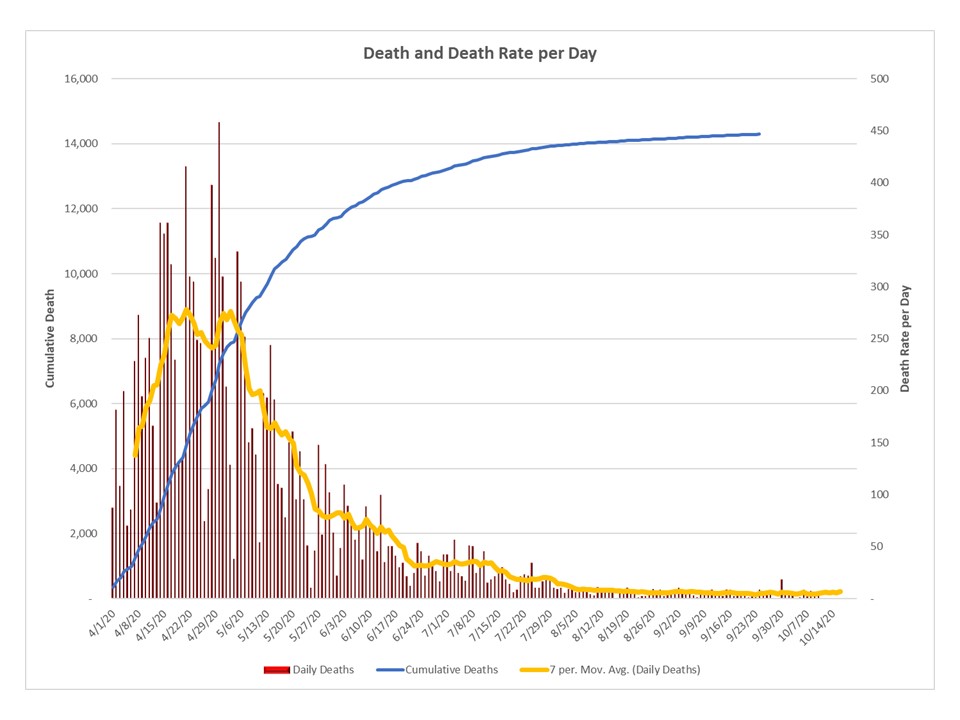
Mortality is low. It seems to almost disappeared as compared to earlier.
The is new infected per day. This is the most worrisome chart. Look at Ocean as the driver.
This is the death chart by LTC and non LTC. Why we still see LTC deaths is beyond reason.