I guess they finally woke up in Trenton so we now have yesterday's stats. Frankly I think they are wrong, LTC is off, but alas what can one expect.
Look at death rate below. Frankly we seem to be at 0.1-0.4% fatality rates, not as grim as was predicted. One suspects that most had some per-existing condition.
The county is coming up slowly due to schools first and gatherings second. All one has to do is see the dozens of school kids walking home and then going into Walgreens to buy candy and effectively spreading it around!
The state is equally reflective of this effect.
Towns still show hot spots.
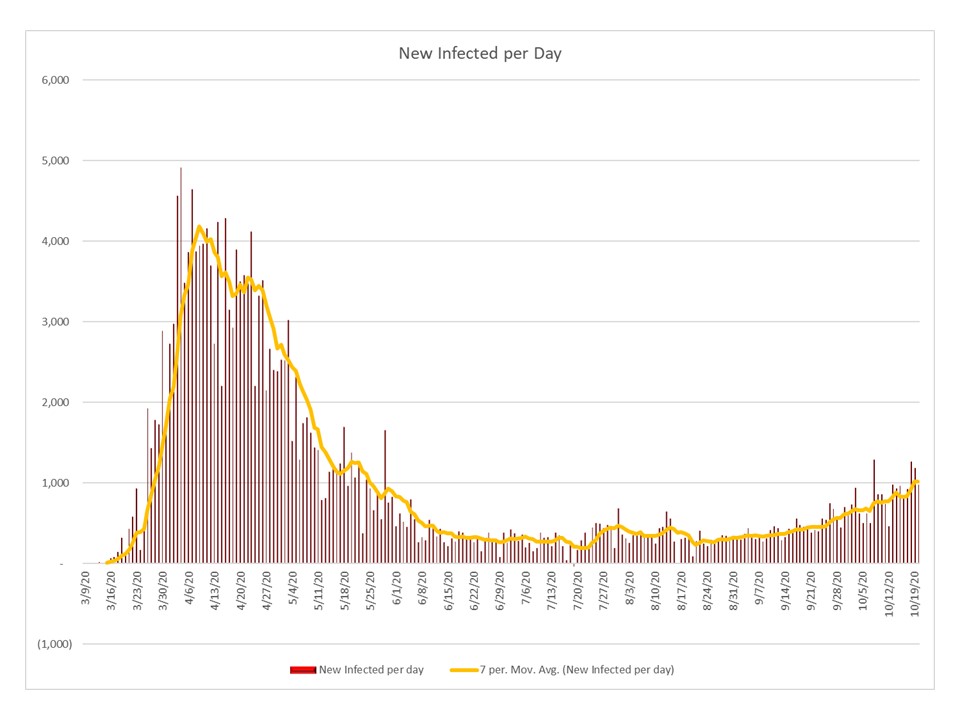
The town below shows almost periodic outbreaks, not your academic's pandemic model, so much for models!
Here we compare town and county by day and we see clearly the peaking. But as I had noted before there is almost some periodic nature to the reporting. This is why I have said many time the data is truly corrupted!