Approaching Labor Day we see the ever increasing infections. This is worse than what is reported since more than 72% of the populations is either vaccinated or previously infected. Thus any numbers we see should be multiplied by at least 4 to compare to last year.
Let us start with the town prevalence. This is absolute and not relative to the unprotected. For the tow we should multiply by almost 10 since 90% are vaccinated or previously infected. This is a massive infection rate.
The county still is increasing whereas the town is decreasing in absolute numbers. In the town we are slowly running out of unprotected people. So much for the herd immunity concept. It was a purely academic construct anyhow.
The town doubling time is increasing which is good news.
But across the county we still have a multiple set of towns with low doubling times.
Death rates across the state are increasing. We still have almost a dozen a week dying in LTC facilities. One should ask how can this occur! The death rate for other than LTC is 1.6%, a worrisome number.
Doubling time for the state is flattening.
We can see this in state numbers
and in county numbers
Deaths are still flat but rates are increasing
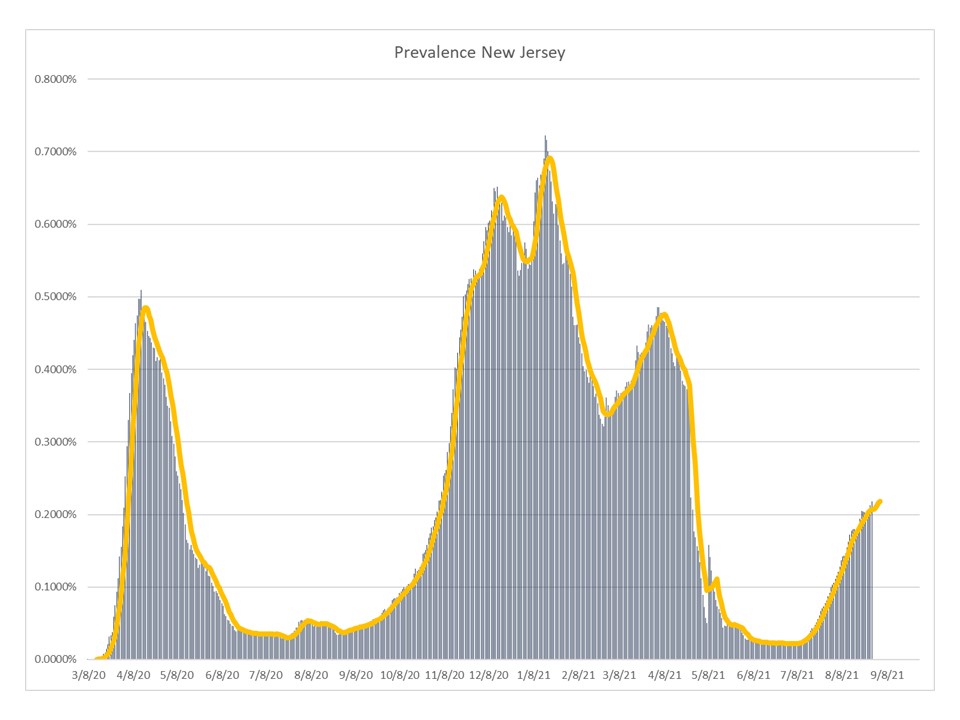
State prevalence is peaking but remember one must multiply by 4! Thus we are worse now than ever before given the vulnerable base!
County prevalence is the same
Usine the extremely questionable CDC numbers we see the ration of infections to vulnerable base we are still high
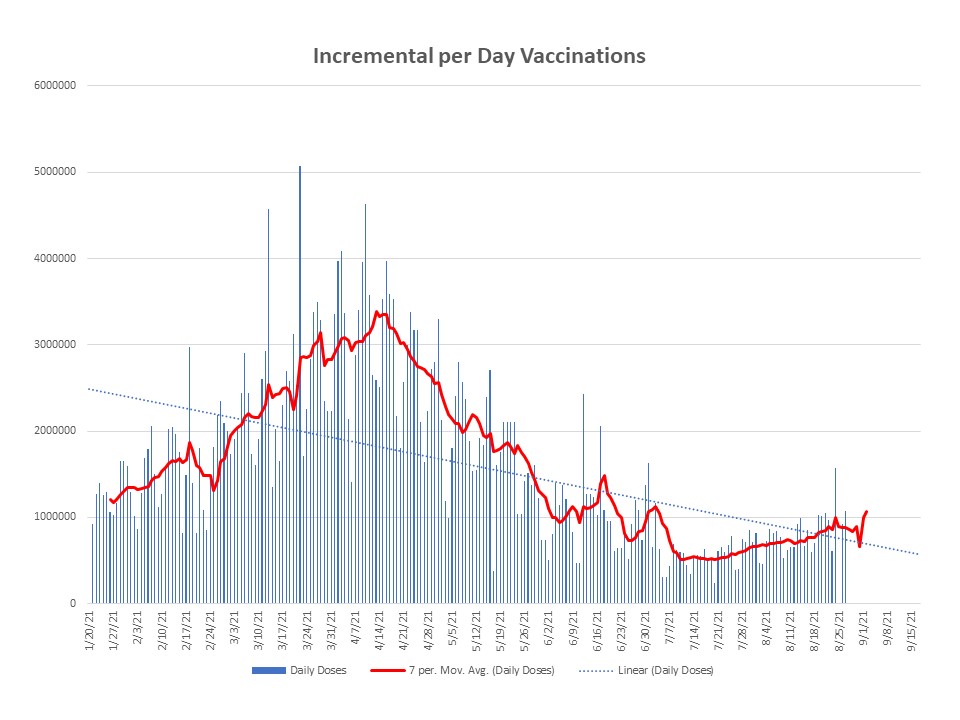
Incremental vaccinations are higher but no where at the desired level
Finally the comparison curve reflects the data problem but an increase in vaccinations.