Let us begin above with town doubling time. It is rising again and approaching the lull of last summer. Below is the incidence per PoP and the town is approaching 6% whereas the hot spots are still clustered at Dover.
The data below are the Town and County numbers. However these are as of yesterday. Yesterday the County recorded an incidence more than twice the running average. Why? It is clear teen agers are now spreading it massively as the weather warms. Large crowds.
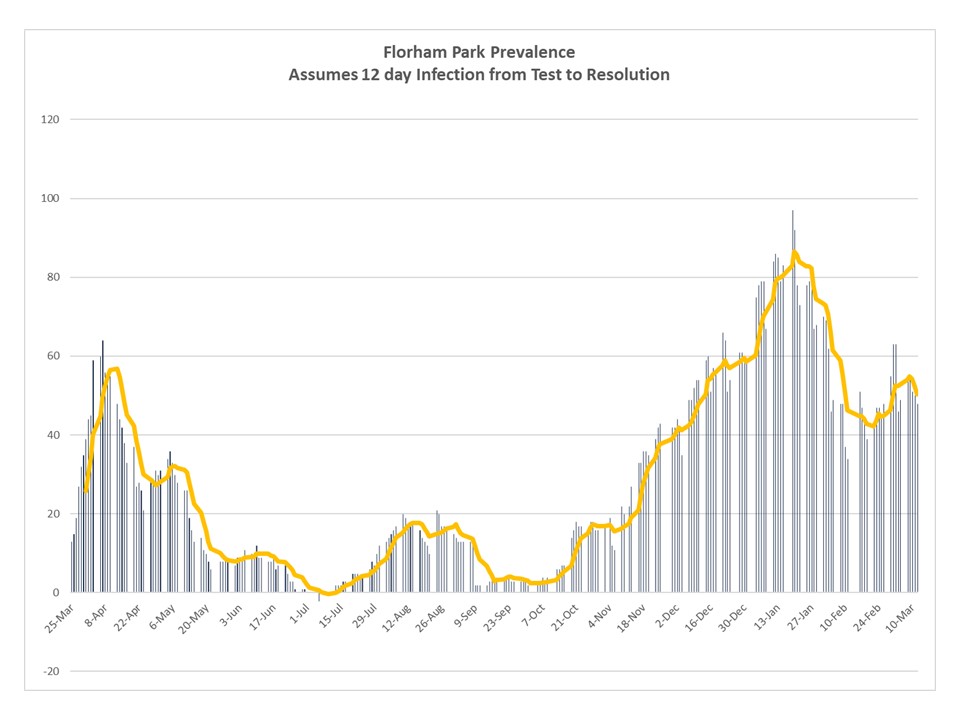
Town prevalence stays at 60. That is high and shows no sign of letting up. But here is the REAL issue. The S
tate has about 25% vaccinated. This the comparable number is not 60 but 4/3 of that or 80! That takes us back to the peak of the winter season.
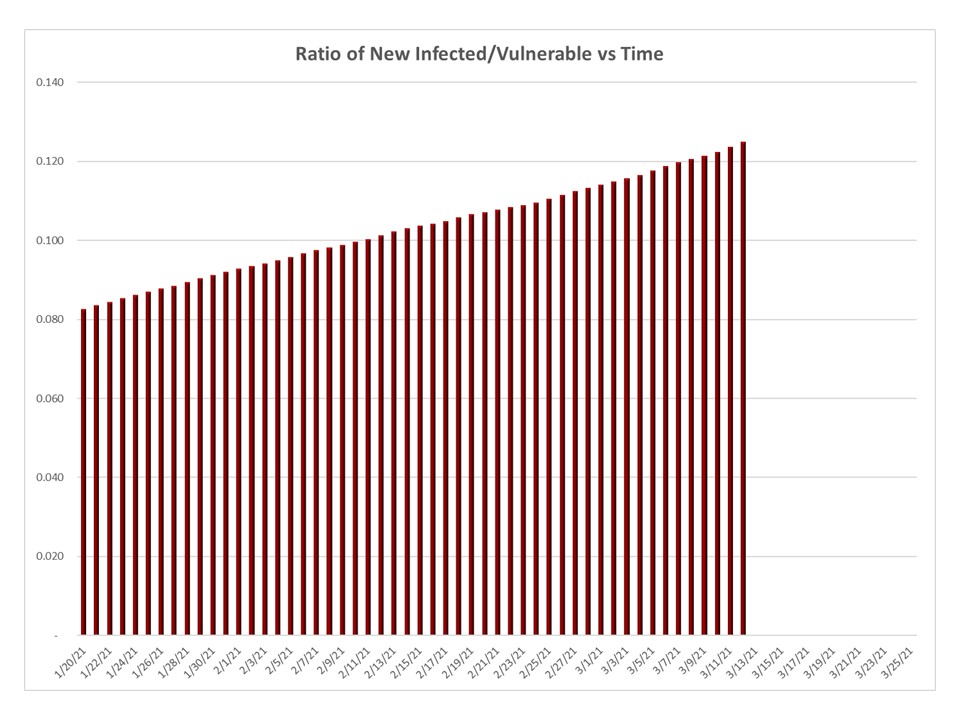
It is critical now to adjust the numbers against a smaller pool of those susceptible. Namely the vulnerable equals the total less the vaccinated less the infected. As the vulnerable decreases the rates of infection may explode!This is what we show below. Namely we see a growth in infected to vulnerable meaning the virus is spreading more rapidly.
The chart below was initially a hopeful chart. Yet the number of daily infections is growing despite almost one third being immune. It does not appear that our brains in DC have seen this one.
This is a list of the push down on vulnerable.
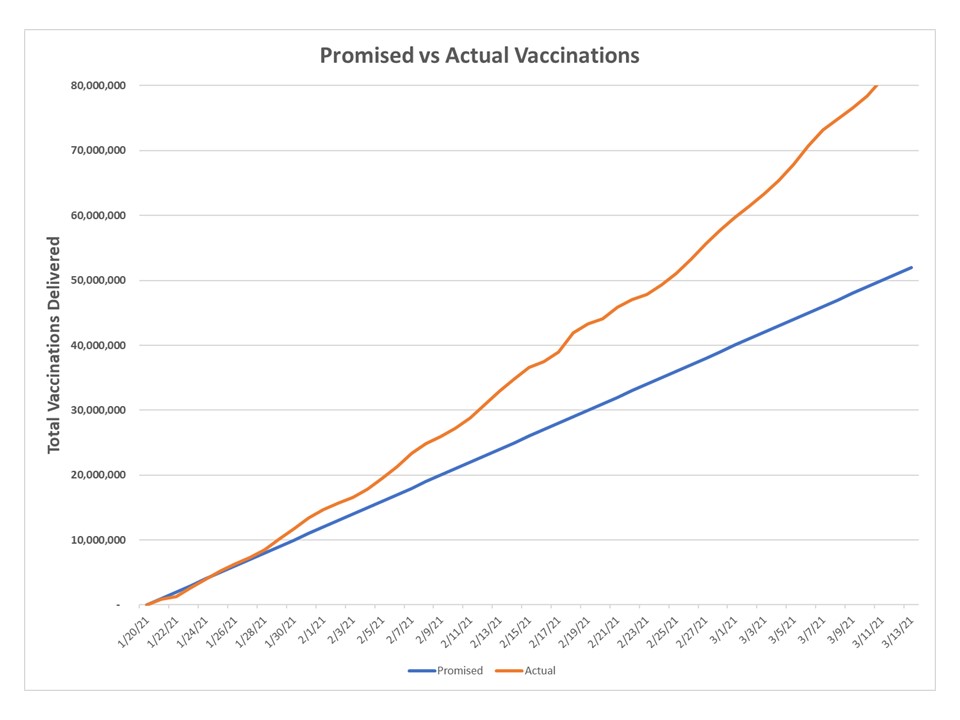
Per day inoculations is approaching 2.5 million. J&J vaccine should increase this.
This is the Biden Curve. Actually it is the Trump Curve under Biden but politics always seem to get in the way.
Here is the State. There is the daily increase and it must reflect an even worse situation since the vulnerable base is much smaller! This is a BAD result.
This is the County. It is a clear demonstration of gross Public Health incompetence. Almost 400 infections in one day pr 600 if you normalize! That is 100 more than the worst day ever! Apparently the County states that the 400+ jump in Montville is due to "lab errors". One wonders how many of these there are.
Doubling time is stable near 200.
Death rates stay just below 2%. High but not as bad as before.
If we can believe these numbers it looks like LTC is approaching 0.
State prevalence is increasing and normalized it is even worse.
Finally County is now spiking and this should be a concern!