We have been at this more than a year, day by day, county by county, town by town. To begin we now have 2.5 million vaccinated, 800,000 infected meaning we have 3.3 million with protection. Thus the vulnerable is 5.7 million. This means we must look at the numbers as reflected on a base less than 2/3s what we had six months ago!
The following shows the problem. We see an increase in infections across the vulnerable base. This needs some explanation. My guess is that the cautious are now vaccinated leaving the risk takers in the pool.
This chart was the mid April assumption as to the alleged herd immunity. We never believed that such would be the case and the data reflects that!Not only are we flat but increasing.
Here is doubling tome for town, dropping like a brick. This is the teen infection base showing itself.
By tow below we see the ongoing high rate clusters.
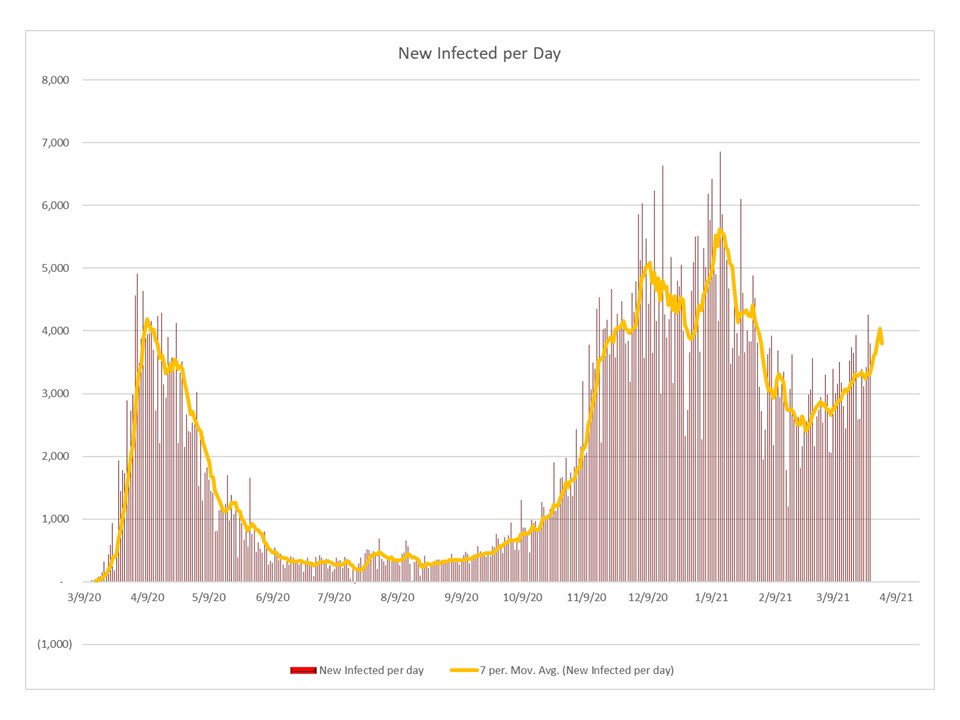
Below is new per day and it is flat and high.
Prevalence is flat and near peak of last year!
The chart below is total for towns.
The one below is the basis of my conjecture.
By race we still have high hispanic.
The State doubling time is below, it is dropping and that is a danger sign.
This is shown below for the State
The County is flat and high.
Mortality sees to continue to drop.
State prevalence is increasing
As is the County
The infections per PoP per county continues to show the State hot spots.