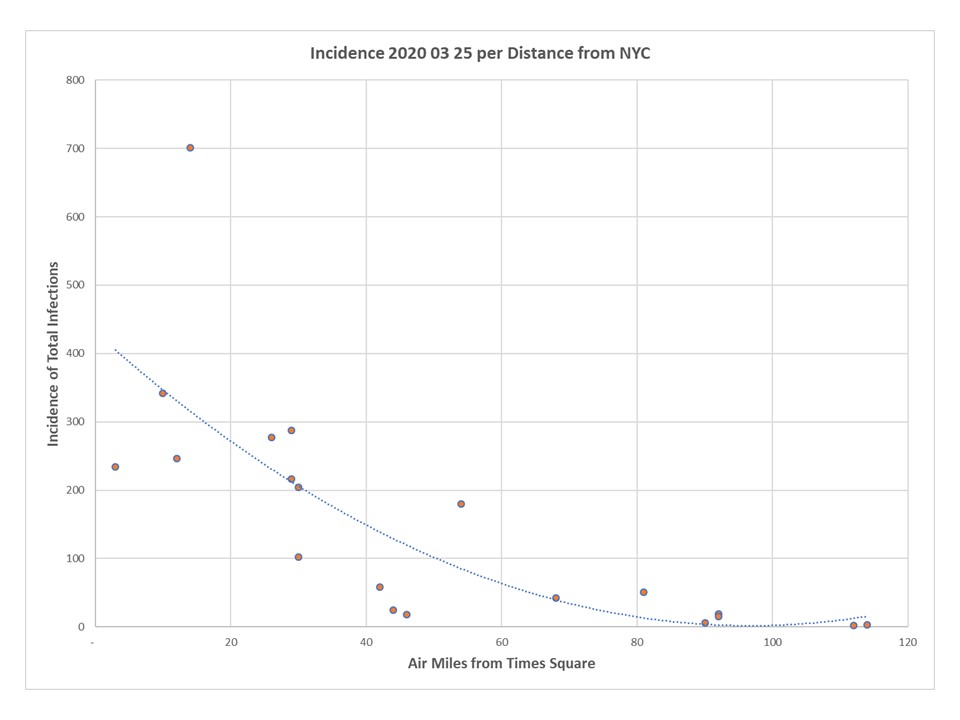

It will be interesting to see how this changes. So far we have seen no one at any of these presentations presenting data on the epidemiological basis. Someone should remember cholera in London!
A blog containing opinion and analysis in a wide array of areas including the economy, health care, broadband and international relations.


