Here we go. Things may be looking up but we have that football thing tomorrow. Also as a note, my grand daughter went off to UMass Amherst. Her classmates were partying for the first week and 200+ came down with the virus. Someone should tell them it will last their entire life and perhaps get worse! I guess their grand-kids will be paying for that mess.
Now to this weeks data.
1. County and Town
The chart below shows Doubling Time vs Infections per PoP. The idea was to see if denser infections meant shorter doubling times. There seems to be no such result.
We continue to see the Dover cluster and the County seems more incompetent than the State!
There are a few hot spots with low doubling times such as Chester Borough.
The new per county and town seem to be declining. Beware football!
2. Vaccinations
Now we start looking at vaccinations. The chart below is the prevalence vs Sites. There seems to be a lower prevalence for more sites making some sense.
Then we looked at sites vs income. Hunterdon county has the highest income and greatest number of sites. Clearly if you are wealthy you get preference. Guess The Banker may be fund raising here for the next election. Also with the data you can't hide it!
The chart below is percent vaccinated and infected. As of today it exceeds 20%.
The breakout looks good. Namely we have 20% total and the vaccinated is 13%. That is now double the infected and a slow but steady growth. Except in Morris County.
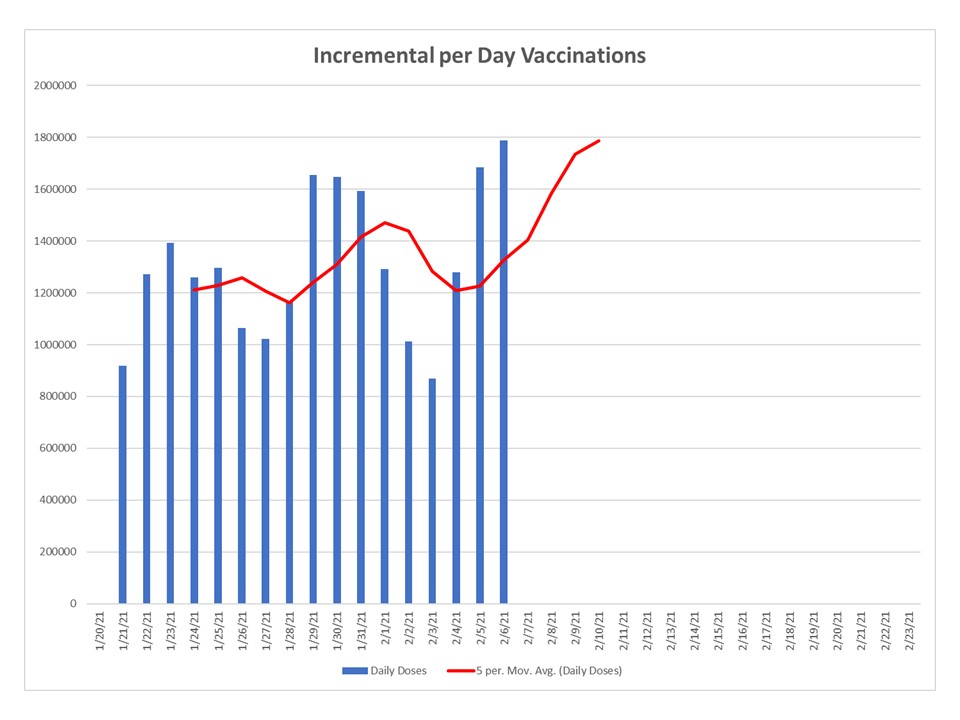
The chart below is the incremental vaccinations per day. We are slowly averaging 1.6 million per day. However is really should be twice that to get to a saturation level. Perhaps J&J vaccinations may help.
The chart below is the growth compared to the Biden Chart, which was already being achieved as of day 1!
3. Mortality
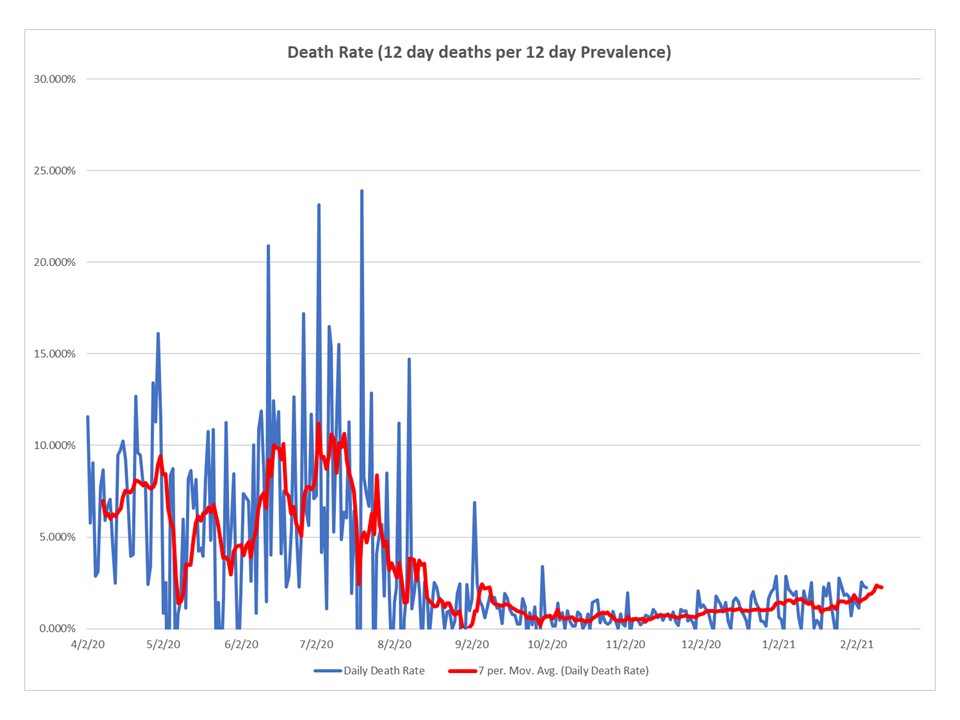
Death rates are still high. Not clear just why. They are well below early a year ago but at that point The Banker's decision to infest the LTCs killed off thousands quickly.
The total long term deaths seem to be dropping.
And the LTC numbers seem to be decreasing. BUT, they should be at zero at this point. There should be some investigation on why they are above zero!
4. NJ Stats
The doubling time is increasing and is back to where we were in mid May of last year.
The State incidence is dropping
As is the County, but slowly
State prevalence is still high
As is the County. The 1:200 prevalence dictates maintaining small crowd size.