Another week and some progress. We start with the town/county mix. The county is decreasing as is the town. We are back to early April for the town and late April for the county. The drop from the holiday peak is good, down 50%.
We continue to look at doubling times vs infection percent. No clear trends here.
Now to the vaccines. The Biden Curve is below. The old Administration was running some 1 million plus per day and the new one seems to be increasing as anticipated.
The percent of US now set for immunity is approaching 25%. Now this should have a force to drive down new infections as we see increases here. We have doubled this number in less than a month. If we keep this trend then by mid March we are well on our way to suppression of the current strain. However, this depends on vaccinating those who present a potential pool for mutations not just 29 year old would be smokers who want to party as Trenton seems to think.
The data below is interesting since we started out having both equal and low we see vaccinations dominating.
I am always amazed as to the daily data. It has a cyclic pattern signifying something, which I have yet to ascertain. But we seem to be hitting 2 million per day. However one always suspects this data and the CDC is quiet on this. They really are a grossly incompetent group.
Death rates still are about 2%. It will take several weeks to shake out this for clarity.
The Banker's Death Curve is below. We still see 10 LTC deaths per day! This is gross immorality. It should have been remedied months ago.
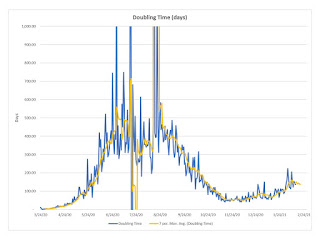
Doubling times for the state are getting back to last June levels.
The new numbers for the state are declining but slowly.
Likewise for the county
The infections per county are getting somewhat flat except for Ocean which is high and Salem which is low.
The state prevalence is back to last May
As is the county.


